DH101

Introduction to Digital Humanities

Month: November 2015 (page 10 of 17)

Network Graph: “The Man At The River”

The story I chose was “The Man At The River” by Dave Eggers.  In this narrative, an American Man bikes to the other side of the river in Sudan with his Sudanese friend who is showing him around.  When they get to the river, Sudanese friend wants to wade across, but the American man doesn’t want to because he has a cut on his shin and is afraid of getting an infection.  The Sudanese Man goes and crosses the river where he meets his other friend, Sudanese Friend 2 who comes back across the river to help the American Man cross the river.  The American Friend is adamant about not wanting to wade through the water, but Friend 2 is very insistent saying that it’s in his culture to help their guests.  Eventually Friend 2 asks a nearby Fisherman to take the American Man across in his canoe.  Finally, the American complies but feels terrible because he feels he has been a lot of trouble and high maintenance.

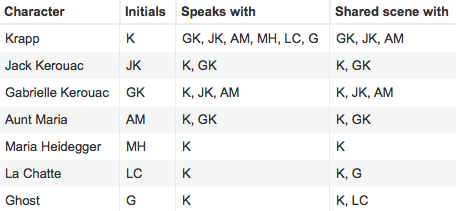
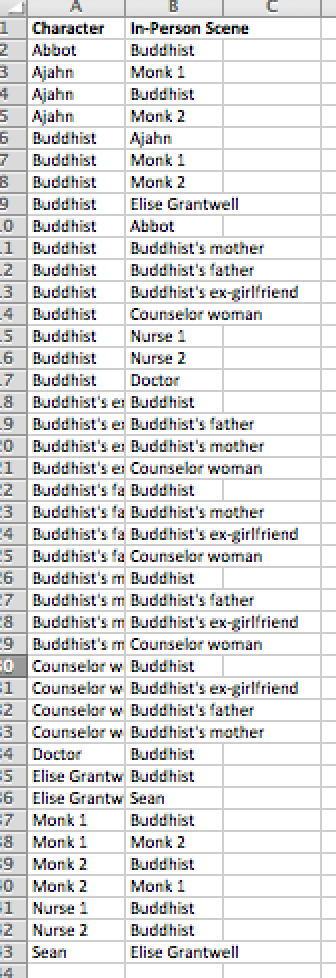
I took the four characters in the story and used Google Fusion Tables to create a network chart.  This is the Node and Edge list I used.

Screen Shot 2015-11-09 at 1.21.41 PM

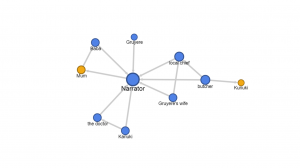
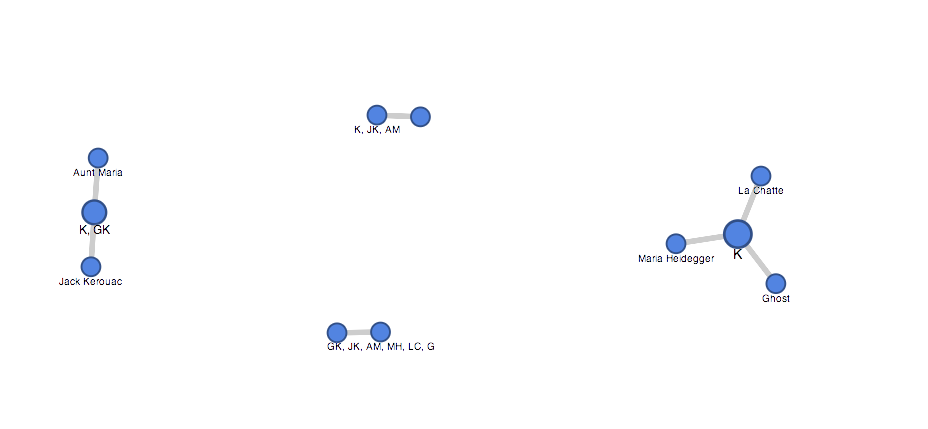
Here’s the network graph I created from this information.

Screen Shot 2015-11-09 at 1.23.30 PM

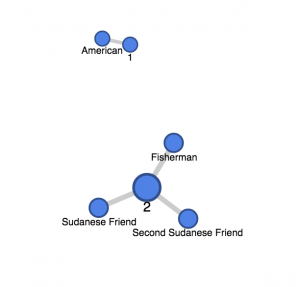
The nodes are the characters in the story and the edges connecting the nodes are those of the same race.  I decided to make the graph like this because the story revolves around the idea of different cultures and beliefs.  In the story, while the American Man is getting a ride in the canoe across the river, he can tell that the two Sudanese men “are forming, or confirming, an idea of this American and all Westerners: that they will not walk across a shallow river, that they insist on commandeering canoes from busy fishermen and being pulled across while they squat inside. That they are afraid to get wet.” which makes him feel like an alienated guest and stranger to these men.

What, if anything, does this network graph illuminate about the characters’ connections? What are its limitations?

The graph illuminates the connections between certain characters, but only a single connection between them.  The graph is unable to give much detail such as what 1 or 2 even means, I had to explain it (the graph wouldn’t separate if I put American and Sudanese under the Race column).  The graph also doesn’t explain the extent/strength of the connections between the characters in each group.  For instance, the Fisherman was a stranger to the two other Sudanese Man, but in this graph it could be assumed they are all great friends because they are all together in the 2 category.

The Buddhist: Character Relations

I chose to read The Buddhist by Alan Rossi for this week’s blog. I looked at the interactions mentioned in the story–narrated in third person–and made the following edge list.

Screen Shot 2015-11-09 at 1.08.28 PM

Note: I included reciprocal relations, as the network seems to be an undirected network.

Below is the resulting network graph, made using Google Fusion Table. You can see it here.

Screen Shot 2015-11-09 at 1.10.45 PM


The nodes are defined as characters in the story; its edges are, again, any conversational or physical interaction indicated by the narrator. The narration became murky towards the middle of the story, as the story shifted from the present to the past in the form of the Buddhist telling a flashback to Elise Grantwell, but the flashback did include dialogue nonetheless, which is why I chose to include those characters and interactions in the network graph as well.

The network graph illuminates upon how central the Buddhist’s role is in the story (well, it’s already obvious given the story’s title… but nonetheless, the network graph confirms this.) The story at first seems to be coming from the narrator’s perspective as if he were a character in the story as well, but reading and mapping out the story proves otherwise.

The network graph is effective in that it is straightforward with mapping out the interactions between nodes. However, it does not accurately show how important Elise Grantwell is in the story, given that she only interacted with the Buddhist. The story is centered upon her interaction with the Buddhist, but the network graph shows only the Buddhist’s role in the story as vital, given that I included the flashbacks. The network graph is also unable to show the depth of conversation between the nodes. Again, the interaction between Elise Grantwell and the Buddhist is extremely important, but the network graph does not make it seem as such.

All I Know About Gertrude Stein

The story i choose to read was called “All I know About Gertrude Stein” written by Jeanette Winterson. Found in the Granta Magazine; Granta115: The F Word, in Summer of 2011

The story is an examination of love. The narrative of the story is given by Louise who is traveling to Paris to understand something about love. In Paris she considers the great love story of Alice Toklas and Gertrude Stein. The love question is harder to solve than the Grand Unified Theory of Everything. It examines how love has changed as women changed to have careers. Alice was from San Francisco but she remained in Paris where Leo moved out of his sister’s home and Alice moved in. They had a great love story that lasted 40 years. They made love new every day. Louise struggles with love as she is supposed to be an independent career woman, but she is a romantic person who strives to make her relationship work. Louise writes “F” is for fear. Louise writes that she and her lover will fail, get frustrated, fall out, fight, all the F words. She also wants him to remember another f word “forgive”. Gertrude Stein wrote The Autobiography of Alice B. Toklas which became a huge best-seller and they travel to the United States to promote the book. In 1946 Gertrude Stein developed stomach cancer and Alice held her hand as she died. Louise’s concludes that women will have to fight and take up arms for love.

Characters:

Louise

Louise’s Lover (Not named in the story)

Alice Toklas (Lover of Gertrude Stein, the thin one cut like a chisel)

Alice’s Mother (who died young)

Gertrude Stein (writer, “the fat one built like a boulder)

Gertrude’s Mother (also died young)

Gertrude’s Brother Leo (painter who lived with Gertrude until she and Alice became lovers)

Pierre Balmain (designer who made suits for Gertrude and Alice)
FullSizeRender-2


From this network graph you can see how the characters are connected. Lines that are closer together are characters with stronger bonds. You can see who knows each other in the story. But it had many limitation. You can tell the names of the Characters, but don’t know anything about them. Don’t know any background on the characters, personality traits, or what their stories are. The network graph just expresses the connections.


Screen Shot 2015-11-09 at 1.28.04 PM

I couldn’t figure out exactly how to make all the connections i wanted to.

Horror Story Network Graph

From the Granta website, I read  Carmen Maria Machado’s Horror Story. The piece centers around a married couple who experience hauntings in the home they share. They experience missing spices, voices, broken windows, vitamins replaced with nails, and even a mirror that shows them as unattractive versions of themselves.  When the hauntings begin, the couple each blame one another, their cat( until it goes missing), or their neighbors for their individual disturbances until they experience them together. I really enjoyed the way the story unraveled and how the couple tries to preserve their marriage as their ghost problem starts to affect their relationship. The ghost manifests itself in emotional disruption that puts the couple against each other. They call a priest, a psychic,and a spiritual medium but none of them can get rid of the presence.  As each character is introduce they each have their own encounter with the presence, except for the priest who was more disturbed by the couple being lesbian.

image


https://www.google.com/fusiontables/data?docid=1eluTDnR3HhR8X0tXfsT_KUCp5scE9zZKE_vndn-T#chartnew:id=3

For the blog assignment, I wanted to illustrate the distinct ghost experiences of the characters. I think the network graph didn’t live up to what I had in mind because my initial excel sheet didn’t provide the correct edges to node relationship. My edge list was the ghost experience. I envisioned something that illustrated what each character experienced individually in effort to illustrate how the ghost was emotionally disturbing to the people in the house including the landlord and previous tenants  and physically violent with the characters who threatened its inhabitancy like the priest, psychic and medium. I visualized a set of connections that supported what I has assumed from the story.  I think I can display this type of connection but not with this sort of graph or the Google fushion table as the medium.

Leila’s Life Through the Definitions of Sexuality and Womanhood

For this week’s blog post, I decided to read Leila Guerriero’s short story titled, I Like Being a Woman (And I Hate Hysterical Women). I thought this was an interesting read because she brought up a different approach to a different lens of sexuality and womanhood on a patriarchal society such as Argentina. In this short story she speaks of certain encounters with specific people in her life who have provided different interpretations and definitions of sexuality and womanhood. These encounters were from family members, friends, strangers, and her present significant other, Diego. The table for the edges (image below) shows the people she encountered in the order that she talks about them in her short story. I also wanted the table to show the age in which this encounter occurs so that it provides further analysis as to what effects this may have made on her.

Screen Shot 2015-11-09 at 12.45.48 PM
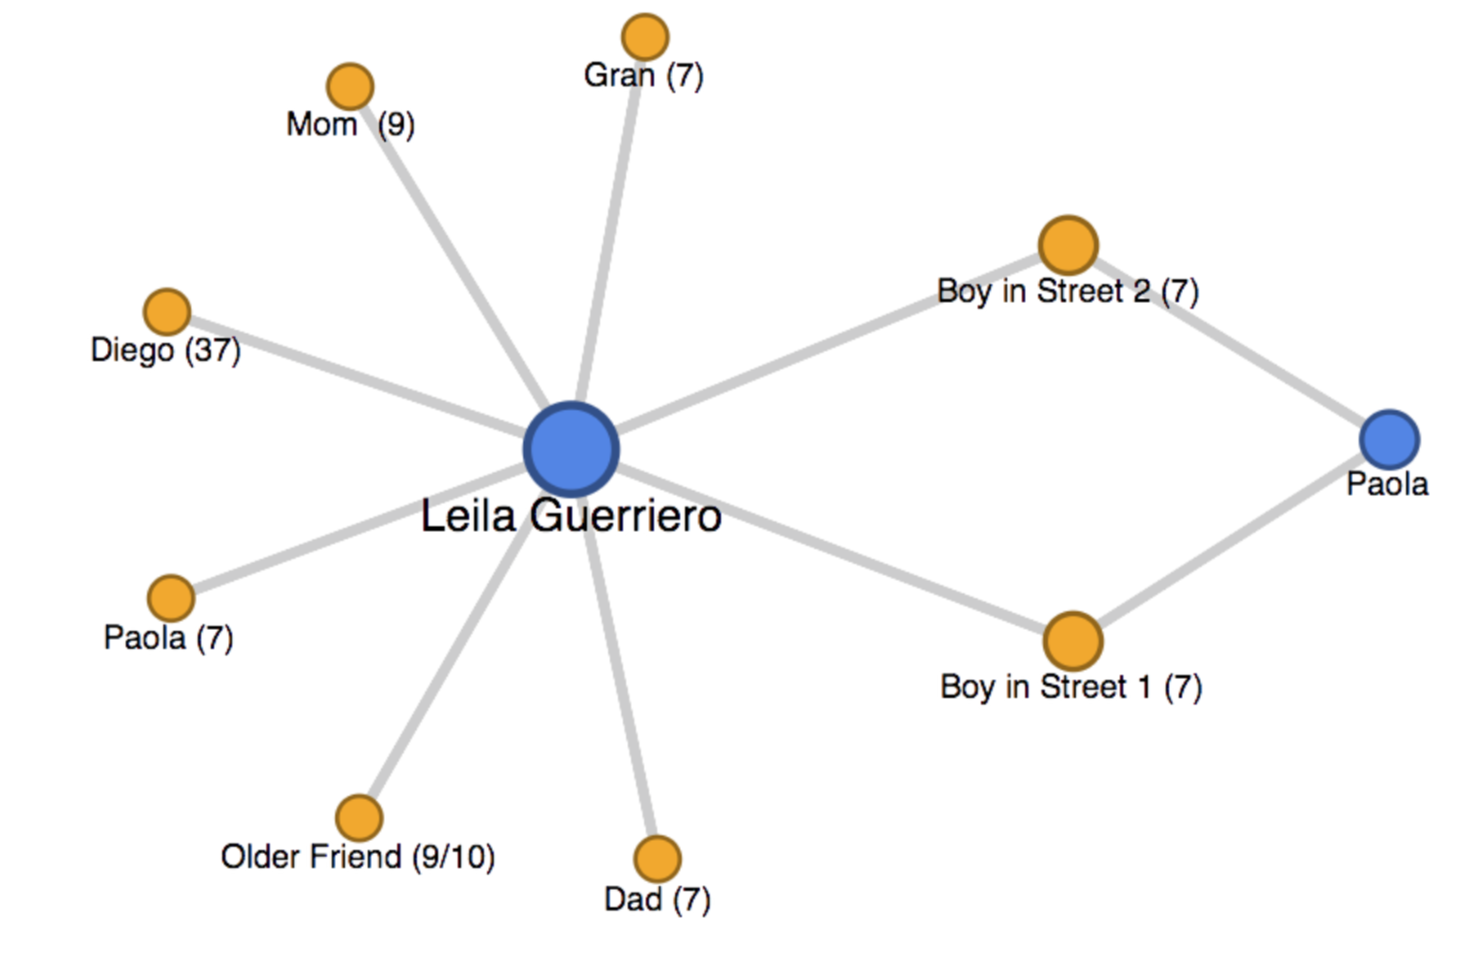
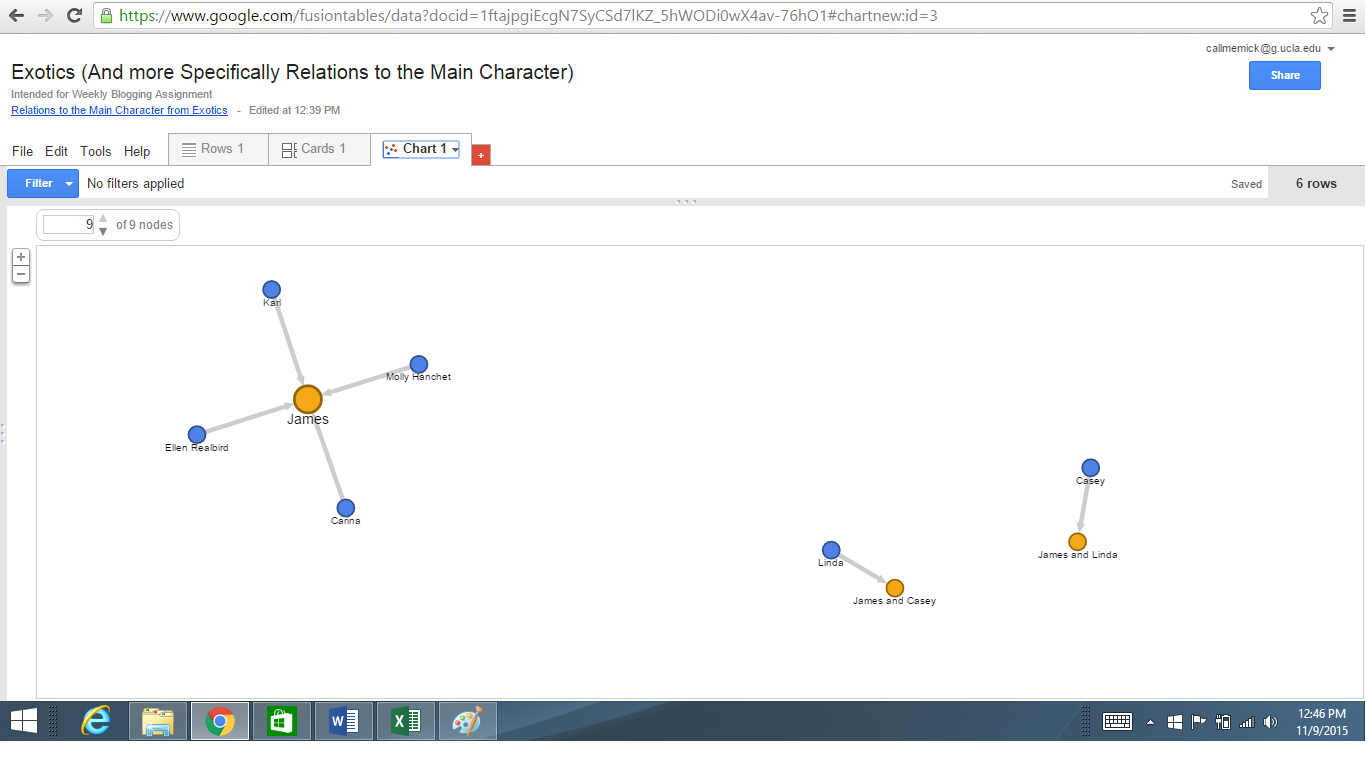
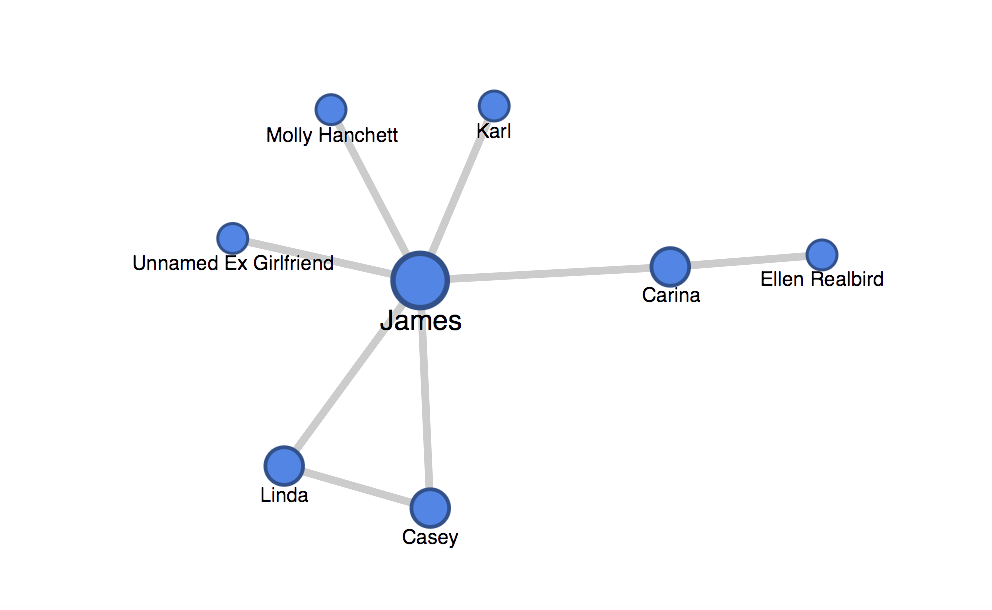
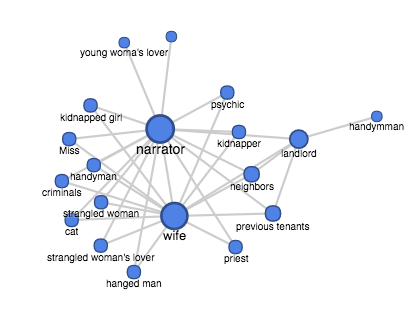
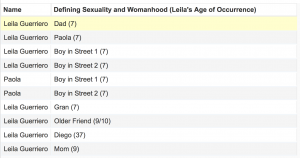
The table also allows you to identify that the relationships weren’t necessarily reciprocated. The reason for this was because these encounters showed that these individuals spoke to her to provide a definition of what she should be as a young girl going through all of womanhood’s developments. In relation to Paola and the strange boys, it reflects a relationship that occurred as Paola was insulted by the boys, but Leila took on a definition from this encounter. The network graph below shows this more clearly:


Screen Shot 2015-11-09 at 12.44.08 PM

Leila is in the center as the central node, or hub of this network graph as she is the one to whom these individuals or nodes, defined these terms to. The limits of this network graph is that it would be better if we could change the colors of the nodes. I would have wanted to color code the nodes to differentiate between the encounters that were positive and those that were negative. This could also be indicated by changing the sizes of the nodes or showing arrows or pointers going to one another, rather than just from Leila to the nodes. For social network graphs, I have had better outcomes when it is done in free form. Meaning that I make the nodes and edges and hubs from scratch with my own legend (image below of an old network graph I did).

Screen Shot 2015-11-09 at 1.09.19 PM

-Karla Contreras

Looking at Relations in One Day I Will Write About This Place

For this post, I read a short passage from African writer Binyavanga Wainaina’s One Day I Will Write About This Place, which is a memoir about his life and travels through Africa; he strives to depict his homeland as it is, and mocks the popular view of Africa as a desolate land. In the passage I read, Wainaina (who I referred to as the “Narrator” in my network graph) is at home and is struggling with the relationship with his parents (denoted as “Baba” and “Mum” in the graph), schooling, and politics. He travels with his friend, Kariuki, through various African towns and interacts with several townspeople, for example the local chief.

The nodes, defined as characters in the story, are connected by edges, to which I defined as any conversational interactions that occurred–whether the characters talked to one another. This became a bit hazy because the writer did not clearly indicate direct dialogue at times, and implied that there was some sort of conversation occurring. For example, when the local chief, narrator, and Kariuki went to the butcher, there were not specifications on who did the talking and only implied the conversation. I still included it as conversational interaction because how else would they have acquired meat?  Additionally, there were clusters of characters who were present in the story, such as a group of women who the local chief interacted with. There was no direct indication of a conversation, but again, it implied dialogue.

However, what is illuminated is the centrality of the narrator. If I were not to read the story, and were to only at this graph (with “Narrator” changed to “Wainaina”), I could tell right away that this story revolves around the perspective and interactions of this character. The graph depicts the story being filtered through the views of this central character, that is so interconnected with so many other nodes–he or she is the driving force of the story.

Nevertheless, again, this network graph lacks the ability to show how much–the depth of–interaction occurred between the narrator and the other characters. While it does illustrate that there is a conversational interaction that has happened, it does not portray the length of the conversations, the importance of the topics, and whether those interactions had any influence over the nodes involved. To solve this, there may have been other meaningful ways to create this network graph that I have overlooked, and other tools that do a better job at capturing the human experience, especially in such potent documentation such as a memoir.

relationsblog

Google Fusion Table

I chose to read Anne Carson’s “Krapp Hour.” Her text appears to be a play featuring a made up game show in which the main character, KRAPP or “K” interviews both historical figures and “fake” characters such as a ghost. I had a hard time really understanding the premise of the show and what the storyline was really getting at. It was somewhat confusing in the show to understand when characters had scenes together. The text would sometimes make note of when the character had exited and other times the text would just state “AM gets up, moves down couch, sits, blackout” and then for the remainder of the text the character would not speak. For this reason only I chose to create my table based on characters that directly spoke to each other, not characters who just shared scenes together.

Screen Shot 2015-11-09 at 12.58.57 PM


The fusion table did not really enlighten me on any connections between the characters. In fact the diagram made it a little more confusing for me. I think this tool would be better implemented in situations where most of the characters were connected by more than just one character. Because in the original excel sheet you can indicate more information I believe this is more helpful in understanding relationships between characters. It is important to understand what tool works best with what data and google fusion chart it not the best tool to use with this storyline.


Screen Shot 2015-11-09 at 12.58.08 PM


Exotics: Week 7 Blogging Assignment

I have decided to choose the short story “Exotic” in order to make a connection table. The story (which I would recommend) can be found here: (Click here for existential short story). This book had very few characters, and the story was more focused on the existential crisis that our main character James faced, rather than on the interactions he had with various other characters, so making a network table that really gave much insight to the story itself was difficult. My table for the graph looked as follows: (I tried to make my central node the main character, and who the other characters interacted with):

Table for Google Fusion


Then I turned this table into a network graphic using Google Fusion, which looks like this:

Graph for Google Fusion


It is clear to see that all of the nodes (other characters in the story) all interact with the central character James. This provides serious insight into the claim that network graphs centrality really depend on what character we start up. It is obvious in this graph that since the central character is James, all of the other characters mentioned have some kind of interaction with him. The peculiar part about this graph is the fact that we also have two other “central” nodes as well. Linda and Casey are husband and wife, and they are the only characters that not only interact with James but with each other too. I could not figure out a way to connect these characters to the central node of interacting with James, while at the same time represent the fact that they interact with each other. The way that my graph represents my data sort of undersells the idea that every single one of the characters have an interaction with James and that he entirely central to the story.

I am a bit disappointed that by my graphs limitations. Of course, this story is all about James, so there is of course a connection between every character and James, but this idea would have been even better represented if I could incorporate the two stray connections and incorporate them into my main connection (James). Of course, the idea of Jame’s centrality to the story can be properly inferred from the graph, but it simply would have been better if I was able to incorporate the two smaller connections into the main one in order to really convey to the one looking at my graph that the entire story is central about James, and really no one else.

Exotics: Character Network Graph

Narrative Summary and Analysis:

The story that I chose was “Exotics” by Callan Wink, which was under the American Wild section. This short story focused on the main character James, and his journey one summer after his girlfriend breaks up with him and his experience as he moves to Montana to Texas to work at a ranch over for a few months. The few supporting characters include Carina, his lover who he cheated on his girlfriend with, Casey, James’ brother and Linda, Casey’s wife, and Karl, James’ boss at the ranch in Texas. There are also brief mentions of interactions between students of James’ and Carina’s, who are both teachers.

There are a couple prominent themes portrayed through this telling of James’ experience. James life of spontaneity and exploration and desperation as he leaves his relationship and works as a ranch hand and sleeps around is juxtaposed with that of his wealthy lawyer brother, with a wife and baby on the way. The author comments on these different lifestyles but doesn’t necessarily say that any one is better than the other. The title “Exotics” comes from a term the ranch owner uses to describe lost or escaped ranch animals, and when James sees a zebra, he ponders how out of place it is and yet will most likely be hunted and treated as any other buffalo or deer in the wild.

Network Graph and Analysis:

I chose to create nodes of all the characters mentioned, and defined the edges as any conversation or any mention of a shared experience. I created a chart based on these relationships between 2 characters, and then created the network on Google fusion and I came up with this.

Screen Shot 2015-11-09 at 12.01.22 PM

The graph does a good job of clearly showing the relationships between the characters, and for someone who has read the story, it effectively represents the different segments of the narrative which and mostly defined by who James is interacting with. However, since it is a pretty simple and straightforward story with only a few characters, I don’t think it really does much that the writing itself doesn’t do. Additionally, without the background of all the characters and their relationships, the graph tells very little. For instance, James relation to his brother Casey is much different than his relationship to his brother’s wife, which is different than the married relationship between Casey and Linda. Yet, all these edges are portrayed the same way with just a line between nodes. I think if the edges could be labeled with more qualifying data about the characters, this network graph would be much more effective in its portrayal of the narrative.

Horror Story

I read a Horror story that was about a couple that moved into a haunted house. The couple heard mysterious noises and things kept disparaging from their home. The solicited help from many different people but nothing seemed to work. when they researched their home they found that horrible things had happened in the house throughout history. The wife of the narrator wants to move, but the narrator is strangely connected to the home. The story ends with the narrator finally seeing some of the ghosts in their bed, a couple similar to their own relationship.

Screen Shot 2015-11-08 at 11.01.44 PM

This the first network graph I made. It shows all the characters and if their are alive or a  ghost. It is a pretty clear graph but it fails in showing the other connections between the characters. It is very simple and does not give a view of the complex relationships in the story. It is also unclear in that the ghosts are assumed because they are people who have died in the house, but only two of the ghosts on the graph were actually seen by the narrator, but there was not a clear way for me to show that.

Screen Shot 2015-11-09 at 9.05.27 AM


This second graph I made shows the relationships between characters. It is biased because the narrator and her wife are the two central characters so they all connect back to them. Most of the other relationships are assumed because they were not explicitly mentioned in the story. While this graph provides more relational analysis, it is not the most accurate because it does not show what relation each person has to the other.

Older posts Newer posts

© 2026 DH101

Theme by Anders NorenUp ↑