From the Granta website, I read Carmen Maria Machado’s Horror Story. The piece centers around a married couple who experience hauntings in the home they share. They experience missing spices, voices, broken windows, vitamins replaced with nails, and even a mirror that shows them as unattractive versions of themselves. When the hauntings begin, the couple each blame one another, their cat( until it goes missing), or their neighbors for their individual disturbances until they experience them together. I really enjoyed the way the story unraveled and how the couple tries to preserve their marriage as their ghost problem starts to affect their relationship. The ghost manifests itself in emotional disruption that puts the couple against each other. They call a priest, a psychic,and a spiritual medium but none of them can get rid of the presence. As each character is introduce they each have their own encounter with the presence, except for the priest who was more disturbed by the couple being lesbian.
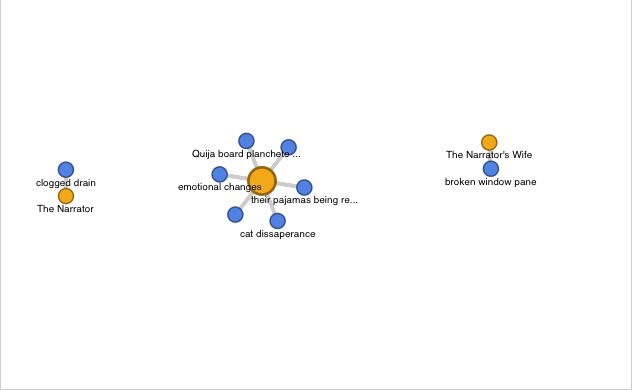
For the blog assignment, I wanted to illustrate the distinct ghost experiences of the characters. I think the network graph didn’t live up to what I had in mind because my initial excel sheet didn’t provide the correct edges to node relationship. My edge list was the ghost experience. I envisioned something that illustrated what each character experienced individually in effort to illustrate how the ghost was emotionally disturbing to the people in the house including the landlord and previous tenants and physically violent with the characters who threatened its inhabitancy like the priest, psychic and medium. I visualized a set of connections that supported what I has assumed from the story. I think I can display this type of connection but not with this sort of graph or the Google fushion table as the medium.