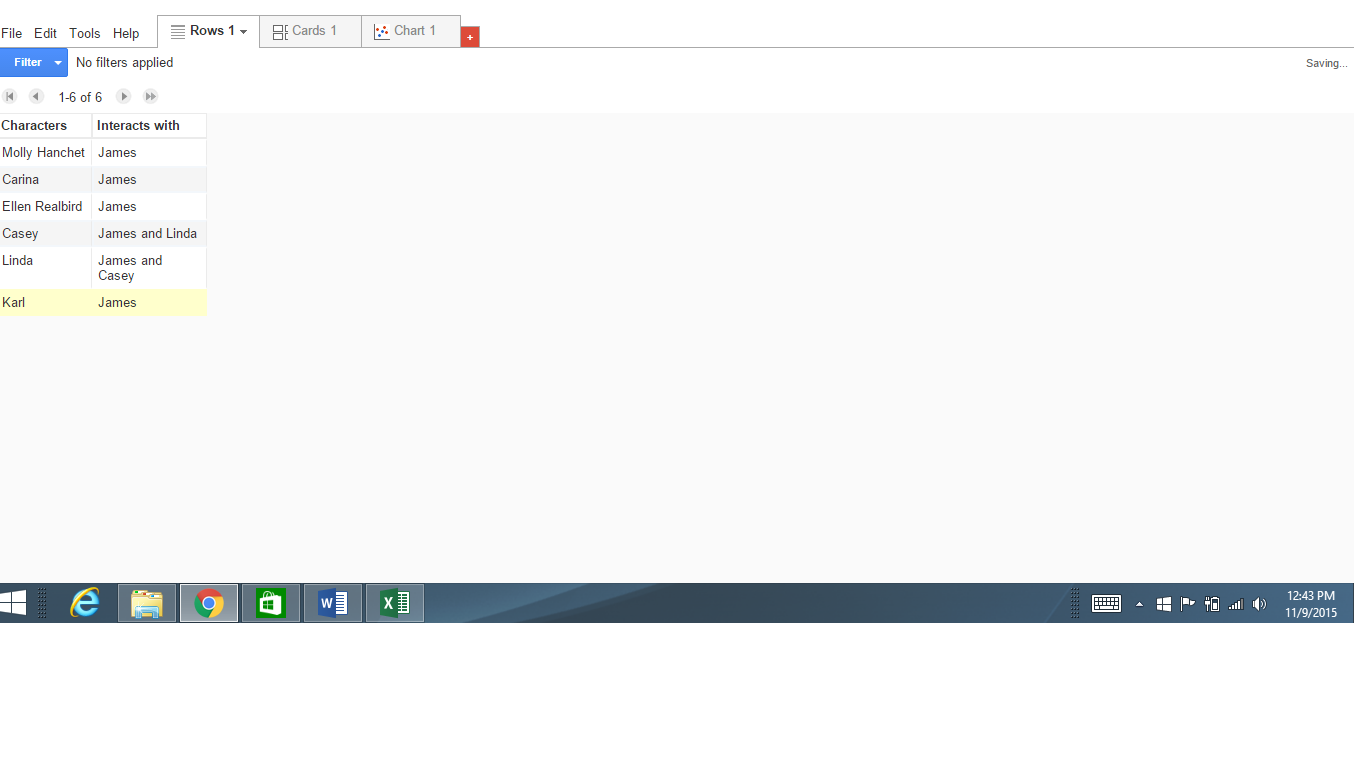
I have decided to choose the short story “Exotic” in order to make a connection table. The story (which I would recommend) can be found here: (Click here for existential short story). This book had very few characters, and the story was more focused on the existential crisis that our main character James faced, rather than on the interactions he had with various other characters, so making a network table that really gave much insight to the story itself was difficult. My table for the graph looked as follows: (I tried to make my central node the main character, and who the other characters interacted with):
Then I turned this table into a network graphic using Google Fusion, which looks like this:
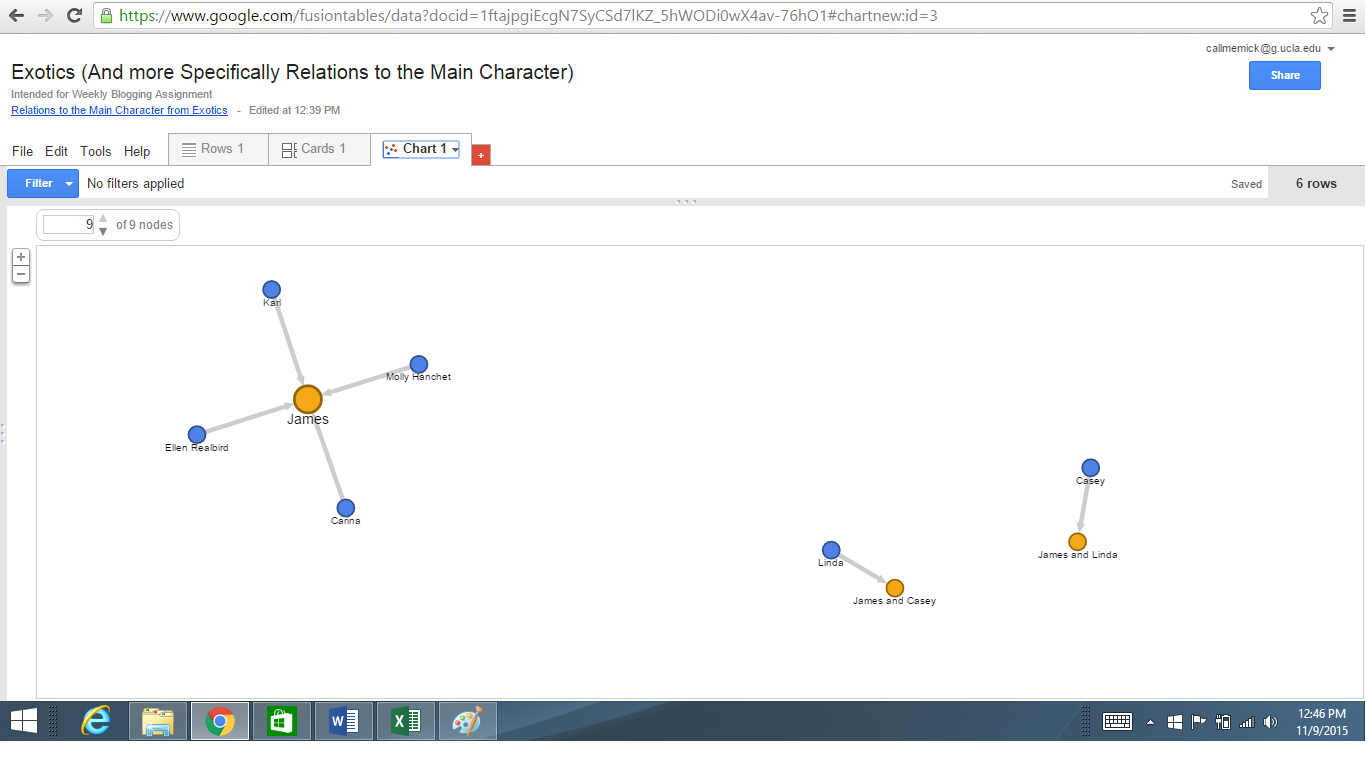
It is clear to see that all of the nodes (other characters in the story) all interact with the central character James. This provides serious insight into the claim that network graphs centrality really depend on what character we start up. It is obvious in this graph that since the central character is James, all of the other characters mentioned have some kind of interaction with him. The peculiar part about this graph is the fact that we also have two other “central” nodes as well. Linda and Casey are husband and wife, and they are the only characters that not only interact with James but with each other too. I could not figure out a way to connect these characters to the central node of interacting with James, while at the same time represent the fact that they interact with each other. The way that my graph represents my data sort of undersells the idea that every single one of the characters have an interaction with James and that he entirely central to the story.
I am a bit disappointed that by my graphs limitations. Of course, this story is all about James, so there is of course a connection between every character and James, but this idea would have been even better represented if I could incorporate the two stray connections and incorporate them into my main connection (James). Of course, the idea of Jame’s centrality to the story can be properly inferred from the graph, but it simply would have been better if I was able to incorporate the two smaller connections into the main one in order to really convey to the one looking at my graph that the entire story is central about James, and really no one else.