Class Blog

Blog Post 7: Network Analysis for “Pink”

This week I decided to read the short story “Pink” by Tomoyuki Hoshino. The story starts off by describing how Japan is suffering a severe heat wave. The main character Naomi starts spinning in circles when she sees fish in a park pond jumping in the air and spinning while suffering from the overbearingly hot water, believing the fish are trying to escape the “hell on Earth” . Later on, she takes her niece Pink to the park again and encounters a young man who tells them that many people have been spinning in circles clockwise as a sort of prayer to beat off the heat wave. As the story progresses, Naomi and Pink join a circle of spinners. At the end of the short story, somehow time has passed significantly fast and Naomi’s life goes to ruins. By the end, when Japan is suffering another heat wave, Naomi attempts to cool off her sister (Pink’s mother) while spinning counter clockwise and hopes to somehow travel back to take her life back and control it herself.
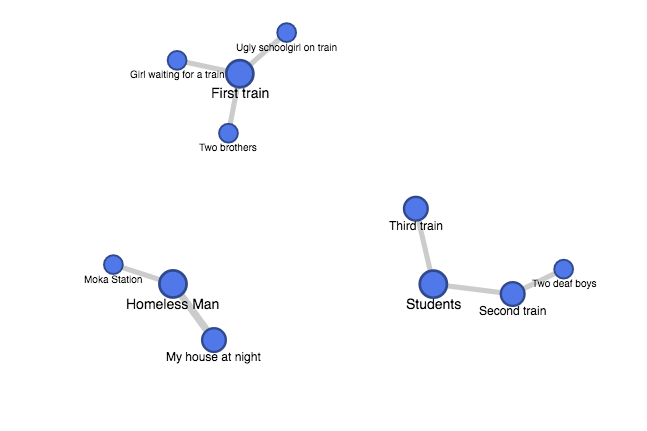
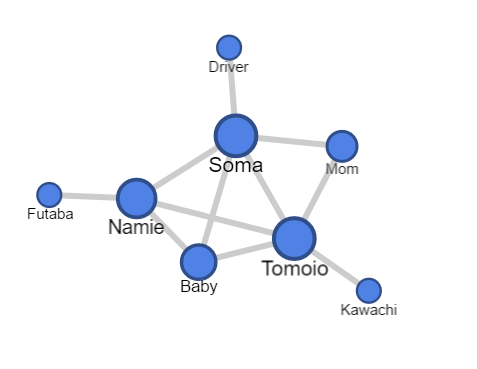
screen-shot-2016-11-13-at-9-19-01-pm

Network Graph
I decided to focus the connections on who were “spinners” in the story and who were never mentioned as spinning. The “spinning” part of the novel was significant, as it ultimately was the connection to how time sped so fas. With limited characters, the network analysis was not large and was not able to show how the “spinning” had an impact on the characters who did it. However, by knowing who were spinners in the story, the viewer gets an idea of why the spinning connection was important. To the young man, spinning was important as it was an escape from the cold reality he lived in, and him telling Naomi about the spinning group changed the course of the story. To Naomi, spinning was an escape from the current moment, not just from the extreme heat but from the unknowing path that life was taking her on. However, her decision to spin and bring Pink along into to it distorted time itself and both their life paths went downhill. The two non-spinners or “unknown” spinners of the story were Pink’s mom and dad. Pink’s father was barely mentioned in the story but Pink’s mother/Naomi’s sister was more significantly mentioned. By knowing that she was not a spinner, it somehow is understood that her time did not seem to move significantly fast, and rather that the disparities that she faced later in life were somehow due to Naomi and Pink’s spinning and distortion of time. The story is  difficult to fully grasp, but understanding that the spinning  and the characters directly involved in spinning were central to the story’s progression makes it easier to try and piece apart.

Network Graph Post

screen-shot-2016-11-13-at-9-30-28-pm

The short story I chose to analyze for my Network Graph is “Athena Sees Good Things for You” This is the story of Patrick Ryan, who was very  desperate for a job and ran into a friend who suggested he apply for a job as a Copy Editor for an unnamed company. Patrick went to the company with his resume and got a short interest with a woman named Mindy, even though he had no experience as a copy editor. After briefly glancing at his resume, Mindy hired him on the spot. Patrick tried to figure out what this job actually entails but no one would give him a definitive answer. After three days of trying to figure out what he needed to do at this job under the supervision of his coworker Kim, he still had no idea what the company even did. When he asked people, they cryptically replied with “We sell things.” The only clue he saw on the wall was a poser of a beautiful blonde woman named Athena that said “Athena Sees Good Things for You.” Finally, Patrick decided to look up the company on google and found that it was a fraudulent company that was scamming people by pretending that there was a mystic fortune teller named Athena who worked for them and predicted the future and helped people become rich. It turns out that Athena never even existed. Patrick becomes fed up with this fraudulent and cryptic company, and quits while on his lunch break and never returns.

For my Network Graph, I chose to analyze the relationships between characters. In one column of my edge list, I had all the characters in the short story. In the next column, I had relationships between people, as defined by the conversations they had. I defined conversation as an unbroken dialogue between people. Finally, I included the weight of the relationship, which was defined as the number of conversations between two specific people. As you can see from the graph, Patrick Ryan has the most connections with all the characters because he is the narrator and the story revolved around him. He has the most conversations (6) with Mindy, his boss, and Kim, his coworker that was put in charge of training him. Patrick had the second most conversations with Inga, who was a kindred spirit and another coworker who actually exposed the ugly truth about the company they were working for. He also had brief one time conversations with the main boss (Lucien), the friend of his who got him the job (Debbie) and some other coworkers (Bald Man and Shriveled Woman). I also included the relationship between Athena and Betty, which Patrick saw in an email. Of course, Athena is actually a fictional person so we do now know the actual creator of the email, but she promises riches to a client named Betty.

The graph illuminates the strong connections between Patrick and Kim and Patrick and Mindy. It also shows us the background characters who did not have strong relationships with Patrick or anyone else.

However, there are a lot of limitations of the graph. When reading this story, I got a sense of very intense and powerful chemistry and bonding of Patrick and Inga. However, because they only had 2 real conversations, this powerful bond is ignored in my Network Graph. All in all, the complexity of relationships is ignored in the graph because the amount of times characters spoke does not tell us anything about their relationship.

Week 7: Network Analysis

The short story “Eight Trains” portrays the narrator’s encounters with people during the daily commute by trains. The essence of the story is encapsulated in a sentence from the story: “It’s (human reality) all pre-planned”. All people the narrator encounters are the unchanged elements within her life, rather than something “simulat[ing] the chaos of life”, as the narrator describes. Therefore, the people who appear in the story revolve around the narrator rather than interact randomly between each other.
screen-shot-2016-11-13-at-9-18-25-pmThe network graph of the people’s connections in the story embodies the statement perfectly. As one can see in the graph, all nodes represented as the people the narrator encounters in the story are connected only to the narrator in the center.
screen-shot-2016-11-13-at-9-19-09-pm

It is more interesting to draw the connections between the people and the places where the encounters take place. The nodes are then separated into three subsets. It is fascinating to notice that only the first half of the commute through eight trains are selected, possibly emphasizing the fact that the first half of the commute leaves a greater impression on the narrator. Also, the appearance of the “Homeless Man” as the central node corresponds to the significance of the character in the story, who appears both in the beginning and the end that marks the theme of the inflexibility of a repetitious life.

The network graph, however, does have its limit in that it cannot point out the significance of connections between the people and the narrator or between the people and the places. For example, one cannot tell what impacts certain characters have on the narrator’s life, or in what contexts certain characters appear in certain places. Such lack of dimensions prevents one who has not read the story from fully grasping the dynamics of the story.

Blog 7 Networking Graph

This week I chose to read the short story “Julie” written by Darcy Padilla. Padilla served as the narrator and the story chronicled the life of Julie, a woman with a drug addiction and a victim of child and domestic abuse. The chapters of the short story follow her ex or current partners and the children she had with them. 

Edge graph

Before creating a network graph, I created an edge graph seen above. I decided that the “edge” between the characters would be relation by blood. There are many family members that this story follows, and I wanted to be able to visualize which characters were blood related to one another. On the right side of the network graph, there are two characters (the narrator and Paul) who do not happen to be blood related to anyone, but play a role in the story and Julie’s life. The narrator was Julie’s “rock” throughout her life, always there for here. Even though the narrator was not related to Julie by blood, she was very important and should be included in the graph.

screen-shot-2016-11-13-at-8-26-50-pm
(Click on graph to view in Google Fusion Tables)

This network graph shows that Julie is the main character and shares a blood relationship to most other characters in the story (because many of the other characters her children). The graph also illuminates who the father of her children are. It shows that she has shared many children with Jason, and one with Jack. Most of Julie’s children were taken away at birth by the government, so Jason Jr is the biological son of Julie and Jason, but also shares a connection to Karen because she is the adoptive mother who renamed him Zach. Julie’s life was very complicated and this graph shows the many people who came in and out of her life.

What this network graph fails to show is the exact relationship between the characters. The “edge” between the characters is blood relation, but the graph would be much more interactive and insightful there was a way to specify what type of relation like mother, father, uncle, etc. This graph also fails to show if the character played a positive or negative impact on Julie’s life. The narrative was all about Julie’s life and her relationships. A way to improve this graph would possibly be to give weight to some characters who made a more positive impact on Julie’s life, but that data would be extremely subjective.

Martha, Martha – Blog Post 7

I created a network graph based on the short story “Martha, Martha” by Zadie Smith. In the story, a real estate agent named Pam Roberts shows a client, Martha Penk, two properties before Martha decides not to purchase either of them. Pam Roberts is a middle-aged woman from the Midwest who is generally good-natured, but is fond of gossip and sometimes expresses xenophobic sentiments. Having arrived in Massachusetts a week ago, Martha has unrealistic notions about the kinds of properties she can afford. She appears to have been part of the working class in England, but hopes to attend a university and to cultivate cultural knowledge. She continually exhibits abrupt and rude behavior, leading Pam to conclude that she is odd and somewhat uncivil. By the end of the story, however, it appears that Martha’s behavior is the result of emotional turmoil. She seems to have left her son and his father in order to chase her academic dreams, and her anguish at this seems to explain why she abruptly declines to purchase and leaves the second property.

screen-shot-2016-11-13-at-8-51-04-pm

There are 22 nodes on my network graph, each signifying a character in the story. I considered a connection between characters to constitute whether one character had spoken to, or about, another character. For instance, while Pam Roberts speaks to Martha, Amelia, and “Middle-Easterny” Man 1, she does not interact directly with most of the characters during the story. While it is implied that she has spoken to each of the people she mentions at some point, she demonstrates most of her relationships to people by sharing gossip about these people rather than actually interacting with them.

The way I formatted this graph is somewhat confusing in that there is no visual distinction between relationships demonstrated by direct interactions and relationships that a character only claims to exist. In one sense, I view this as a limitation of this network graph. However, it can also become an aid to understanding the story in that the same kind of confusion between knowing a person and knowing about a person occurs in the story. It is clear that whether Pam Roberts interacts with a person, or only describes a previous interaction, she views everyone she interacts with as little more than a source of gossip. Though Pam speaks with Yousef’s wife, Amelia, and only describes the Professor’s wife, both wives appear equally two-dimensional because Pam’s assumptions entirely define them. Pam’s assumptions about Martha, though unfounded, even begin to affect how Yousef and Amelia view her.

No one truly knows anyone in this story, and so every relationship’s value is limited. For this reason, this network graph is deceptive in another key way. Although Pam Roberts has the most connections, none of them are particularly deep or meaningful. She deems a man she meets to sound “Middle-Easterny” and does not even ask him his name (she applies the same assumption to his three companions). Even when Pam mentions her three daughters, the reference is fleeting and not necessarily fond. Yet Martha, who has fewer connections and seems disagreeable for most of the story, actually has two very deep connections in Ben and Jamal. The number of connections is not at all indicative of their depth—in fact, this seems to be an inverse relationship.

Note: though not technically a “character,” I included the Snowman as a node because it is a helpful focal point for viewing the relationships between the four men.

Week 7 – Hush Hush Sweet Charlotte

7

I created this chart in order to illustrate the interactions between various characters from the story Hush Hush Sweet Charlotte. For my character chart, the connections were made if the two characters either spoke or physically touched each other. Through this chart, I believe it will be easy to conclude who the main characters of the story were- Soma and Tomoio- since they had the most connections with other characters. However, other than that fact, this chart doesn’t really relay much information. Actually, the chart doesn’t even accurately portray who the main characters were in the story. Although both Soma and Tomoio did play a big role in the story, the story actually revolved more around Soma and the Baby with Namie and Tomoio playing the 2nd lead roles. This could potentially be solved by making Soma and the Baby’s nodes a bit bigger in comparison while also increasing the weight of the connection itself (maybe could be shown by changing the color of the connection). Furthermore, the presence of the sub main character in the story changed as the story continued; although Tomoio did play a big role in the beginning of the story, his presence was eventually replaced when Namie came into the story. This sort of information could be easily shown if we were able to show the node size and connection weight changing over time.

Blog 7: Network Analysis and Eel Stores

For this network analysis assignment, I decided to create a network graph based off the characters from Misuyo Kakuta’s short story, Bucket of Eels. Bucket of Eels implicitly tells a narrative of Kakuta’s love life as she explores the city of Tokyo, Japan. As the story progress, we find the narrator empathize with the eel shop owner’s wife.

eels1

After reading the short story, I created an edge list consisting of two columns, eels stores and characters that the narrator interact with in corresponding store, representing my nodes. The connection between the store and character is depicted as “edges” to illustrate the interaction the narrator had with the said character at said store. I wanted to show the relationship between the narrator and the people she interacts with at the different stores, to illustrate any possible connection between each other. Ultimately, the readers can clearly see that the owner’s wife both appeared in both stores. As someone looking at this particular network visualization without any context of the story, one can be very puzzled by this because we see that the connection is the store owner’s wife of two different stores.

eels2

(note: I tried to embed the google fusion graph onto my blog post, but was very unsuccessful. So, here’s a snapshot!)

In fact, spoiler, the narrator sees herself in the store owner’s shoes, unhappy with her love life and struggles to be content with her partner. In the story, she eavesdrops the conversation between the store owner and his wife at the first eel store Isshin, noting the especially harsh tones and attacking language that’s not often displayed in public. As time progresses, she runs into the same woman at another store with what seems to be another eel chef. The narrator infers that the woman’s previous marriage was unsuccessful, which is later revealed that the previous husband eloped with another women. She empathizes with the store owner’s wife because she sees herself unhappy with the 3 people she dated in her life. The story sheds some light as the narrator realizes that she should not compare herself to others as it may have been all in her head when she confronts the store owner’s wife.

This network graph tells the audience quite a lot about the relationship between the narrator with these characters in the eel shops. However, upon closer inspection it only tells so much, that she ran into the same lady at the different stores, but it omits this powerful narrative disclosed in the paragraph above. Although this graph was very simple, I hope implement network graphs within my own digital humanities project to be able to make connections that may not have occurred to me before.

Network Graph for “The Ferryman”

The story I chose to read was “The Ferryman” by Azam Ahmed, which you can read here. This is a first person narrative told from the perspective of Malik, a man who transports dead bodies in Afghanistan. In this particular instance he is asked to make a deal with a Tabilan commander, Raheem Gul, to bring back some American bodies. Doing so will put his friend, Commander Farhad in favor with the American soldiers.

Here is my network graph.

In making the network graph, I chose to define an edge as characters having direct conversation with each other. This story only has a few characters that speak, so it is not a very complex graph. However, think that it does illuminate something about the interactions between the characters. For one thing, it reveals that Malik is the main character of the story because he has direct conversation with everyone else. Additionally, we can see 3 real groups or communities that have formed. There is {Malik, Farad, and the American soldier}, {Malik and Bilal}, and {Malik and Raheem Gul}. These make sense because most of these characters have connections to Malik, but not to each other. The network graph illustrates this well.

One limitation of the network graph is that it fails to show the strength of the connection. For example, Malik and Farhad are friends, or at least know each other well, while Malik and the American soldier have never spoken before this conversation, yet both the connections appear to hold the same value on the graph. This could be somewhat remedied using weights on the edges, however, it would be difficult to operationalize relationships.

Week 8 — Foreign Bodies

For this blog post, I chose to read Foreign Bodies, by Peregrine Hodson from the Granta Magazine, Edition 46 under Essays and Memoir published March 1st, 1994.

The short story revolves around a horrible crime that occurred when a group of friends went to vacation in Morocco. There were four friends: Amanda, Roddy, Jane, and the narrator, who is dating Jane. As soon as the story begins, the narrator makes it clear that Amanda has gone home early because she missed her dog. The narrator also makes it clear that Roddy and him are friends, and that although Jane and him have been dating for three years, they know they will not be together forever and will eventually break up. While there, they have sexual intercourse, but both know that there is not a real connection there and it will end soon- probably when they return from the vacation.

On the last night there, they decide to go to the beach and watch the waves hit the coast. While there, a French guy comes and offers to smoke kif with them, which they agree. They engage in conversation, and eventually, two of the French guy’s friends join them. Their names are never given, so in the table, I simply call them “man one” and “man two”. As time passes, two more of the French guy’s friends come and they are soldiers. One is described to be thin and the other tall. In the table, I refer to them as “thin soldier” and “tall soldier.

When the narrator notices that they begin to speak in Arabic together, he gets a bad feeling and decides they should leave. As they begin to pack their things, the French guy attacks him. He tells Roddy to go find help and as he runs away, “man one” and “man two” run after him. The French guy keeps the narrator pinned to the floor and forces him to watch as his soldier friends take turns raping Jane.

After the rape is concluded, they all leave and the narrator is left with Jane, who is hurt. He holds her as they watch the waves and wait for Roddy to return (assuming he has outrun both men and will return).

I created a table on Google Fusion tables, which you can find here: Connections

Disclaimer: Creating a table linking everyone was difficult, mainly because very few of the characters knew one another or had any real connections. There are other limitations, such as knowing whether or not the French guy’s soldier friends and the other friends knew one another or were summoned there by the French guy. Additionally, we do not know how strong their bond is, though I am assuming it is strong if they planned a rape together. Additionally, because the details in this story were slim, there was no way to know the length of their relationship either.


The Waiter’s Wife

I chose the short story titled, “The Waiter’s Wife“. This is about a married couple, Samad and Aslana, who immigrated to London from Bangladesh in 1975. They moved in order to live closer to a friend of Samad’s, Archie whom he had served in the war with. Both Samad and Archie are married to much younger women, the before mentioned, Aslana and Clara. Samad works as a waiter in his cousins restaurant, alongside other distant family members. His job is hard as he works long hours and receives little pay for it. His struggles continue when Aslana violently confronts him about their low income and her concerns about feeding their unborn twins. After the confrontation, she meets with Clara, who is also pregnant, and her cousin, the shoemaker, Neena. The three sit on a bench in a park and discuss their lives. Aslana reveals that her and Sadam had a arranged marriage and she dislikes him more as time progresses. Neena tries to console her by giving her advice to communicate more with him in order to solve problems together. Aslana disagrees with this, as she maintains her traditional role in the marriage. As the conversation about Aslana’s life and her expectance of two twin boys continues, Neena mentions the idea of abortion. This completely shocks and appalls both Aslana and Clara so much so that a nearby park keeper comes by to inquire if everything is alright. Aslana states that because her and Clara married older men, their children will always struggle with having roots in both the past and the present, which seems to be an underlying theme throughout the short story.  When they affirm that they are alright, the male park keeper retreats through the park trees as the women wave goodbye to him.

the-waiters-wife

This short story deals primarily with the struggles between time and age  and the differences that those factors can have on daily life. I  entered the following information in the column tabs of my edge list, “name, job, ethnicity, gender, married” in order to categorize the characters. When I plugged them into the Fusion Table, I found that the graph is most illuminated when I compared ethnicity to job type. This created a more cohesive graph in which I was able to visualize the connections between ethnicity and where the characters worked. Because this short story deals with subtle, but complex, issues regarding the tensions that arise between generations the impact of this graph was greatly minimized because I could only compare two  elements at a time. It would have been far more engaging to incorporate more elements or another type of software in order to create a more robust network of relations that span across multiple categories.