Network Graph Post

screen-shot-2016-11-13-at-9-30-28-pm

The short story I chose to analyze for my Network Graph is “Athena Sees Good Things for You” This is the story of Patrick Ryan, who was very  desperate for a job and ran into a friend who suggested he apply for a job as a Copy Editor for an unnamed company. Patrick went to the company with his resume and got a short interest with a woman named Mindy, even though he had no experience as a copy editor. After briefly glancing at his resume, Mindy hired him on the spot. Patrick tried to figure out what this job actually entails but no one would give him a definitive answer. After three days of trying to figure out what he needed to do at this job under the supervision of his coworker Kim, he still had no idea what the company even did. When he asked people, they cryptically replied with “We sell things.” The only clue he saw on the wall was a poser of a beautiful blonde woman named Athena that said “Athena Sees Good Things for You.” Finally, Patrick decided to look up the company on google and found that it was a fraudulent company that was scamming people by pretending that there was a mystic fortune teller named Athena who worked for them and predicted the future and helped people become rich. It turns out that Athena never even existed. Patrick becomes fed up with this fraudulent and cryptic company, and quits while on his lunch break and never returns.

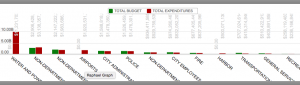
For my Network Graph, I chose to analyze the relationships between characters. In one column of my edge list, I had all the characters in the short story. In the next column, I had relationships between people, as defined by the conversations they had. I defined conversation as an unbroken dialogue between people. Finally, I included the weight of the relationship, which was defined as the number of conversations between two specific people. As you can see from the graph, Patrick Ryan has the most connections with all the characters because he is the narrator and the story revolved around him. He has the most conversations (6) with Mindy, his boss, and Kim, his coworker that was put in charge of training him. Patrick had the second most conversations with Inga, who was a kindred spirit and another coworker who actually exposed the ugly truth about the company they were working for. He also had brief one time conversations with the main boss (Lucien), the friend of his who got him the job (Debbie) and some other coworkers (Bald Man and Shriveled Woman). I also included the relationship between Athena and Betty, which Patrick saw in an email. Of course, Athena is actually a fictional person so we do now know the actual creator of the email, but she promises riches to a client named Betty.

The graph illuminates the strong connections between Patrick and Kim and Patrick and Mindy. It also shows us the background characters who did not have strong relationships with Patrick or anyone else.

However, there are a lot of limitations of the graph. When reading this story, I got a sense of very intense and powerful chemistry and bonding of Patrick and Inga. However, because they only had 2 real conversations, this powerful bond is ignored in my Network Graph. All in all, the complexity of relationships is ignored in the graph because the amount of times characters spoke does not tell us anything about their relationship.

Week 7 Map Blog Post

For this weeks blog post, I chose to analyze the map, Digital Harlem. This is described as a collaborative research project focusing on everyday life in Harlem between 1915 and 1930. It was created by 4 historians from the University of Sydney.

The assumptions made by this map are problematic. After simply reading the about page of this project, I can see that the map is not an accurate description of life in Harlem. The description of the map outwardly states that it focuses on the lives of “ordinary African New Yorkers.” Harlem is a historically black town, but this map makes it seem like the population of Harlem is 100% black. Because of the time period this was from, it could be deducted that most law enforcement and government officials, as well as journalists, were White people because of the prejudice that black people encountered while trying to find jobs. Already, the viewer is aware of the divide between the black ordinary citizen and the white law enforcer and journalist. Furthermore, the about page states that the way it encompasses the ordinary life of these people is primarily through legal records. Already, this casts a huge stigma on the project. It seems as though these people’s lives are only documented through legal records. This is an extremely dehumanizing and quite racist approach to the map. It’s basically placing an entire culture, way of life, and community into nothing but legal records. It tells the viewer that these people are only characterized by the crimes they committed, and nothing else. This is the main assumption that this map makes- the idea that this community should only be known by its crimes and legal records.

This map, in my opinion, could not come from a more problematic perspective. The creators of this map are from Australia. I think is worth noting that they are from a completely different country, with absolutely no idea of what real life in Harlem was like. They also never mentioned employing real people from Harlem for an inside perspective or anyone with any real knowledge of Harlem. Clearly, the perspective of the map comes from these historians from Australia. However, because they relied so heavily on legal records, the perspective of the map is also from the legal force such as the police, as well as government officials such as judges, lawyers, etc. This is hugely problematic as well because the legal system is often found to be corrupt and racist. Because this project is from the historical times of Harlem, I have no doubt that some of those legal records are shadowed in racism and prejudice.

This map reveals the multitude of legal records from Harlem between 1915 and 1930. These records come from the District Attorney’s Closed Case Files, the Probation Department Case Files, various newspapers, the Committee of Fourteen Papers (investigation reports on women arrested for prostitution), and the Writers Program Collection. It is worth noting that the only one of these sources to portray citizens of Harlem in a positive light is the Writers Program Collection. This collection has research on institutions and life in Harlem and includes information on churches, schools, and various organizations. All of the other sources used for this map only report the criminal, negative, and newsworthy things that happened. Because an event must be dramatic enough to be reported, it is often also a negative event. This map does not reveal much at all. It simply gives me a multitude of various offences and legal occurrences that happened, where they happened exactly, who was involved, the race and gender of those involved, and the convictions they faced.

This map obscures many things. The map does NOT reveal the everyday life of citizens, nor does it tell me anything about this thriving, fascinating, and interesting community. It gives me no context for any of the events it portrays. It gives me no history or background on the community or any of its citizens. It does not even give me positive events which happened in the city. It is restricted to only the bad things that happened.

If I were to create an alternate map, I would provide a point of view from people who actually lived from Harlem or are from Harlem. This would include sources such as narratives, interviews, journals, essays, etc. with people who have a perspective from Harlem. I would try to find sources that were created only by members of the community, and not just law enforcement or journalism. I would incorporate more cultural aspects of the community, and focus on things such as music, food, dance, literature, etc. As Turnbull accurately stated, maps are selective in that the mapmaker determines its contents. The mapmaker has the ability to choose what is and is not represented in the map, and in my opinion this mapmaker did a poor job of choosing what to represent in order to provide a picture of ordinary life in Harlem.

Week 4 Blog Post- Data Visualization

For this assignment, I was interested in the Diamond Prices Database. This database included prices of cut diamonds, along with data on color, clarity, and ratings agency. It was taken from the Journal of Statistics Education online data archive. It includes data from 308 round-cut diamonds, taken from a newspaper ad. It had a column for ID number, color, clarity, rater, and price of the diamond. I had to manipulate the data-set itself in order to make it presentable in a visual way.

The first thing I did when I opened the data-set was remove the column for Identification Numbers because this was just numbers 1-308 numbering the diamonds in order. It was useless to me. Then, I deleted the column called Rater, which showed which one of three independent rating agencies rated the specific diamond. I was not interested in who rated the diamond, so this information was useless to me.

The next thing I did to the data-set was change the Color column from alphabetic data to numeric data. Color refers to the degree of color purity in the diamond. In the legend of the data, it said that the color of the diamond was rated on an alphabetic scale from D-I, where D represents the top color purity grade, lesser than D is E, then F, then G, then H, then I. I though that numbers from 1-6 would do the exact same job of representing the color purity of the diamond, and would be easier to present visually. I changed all the D’s to 1, then the E’s to 2, then the F’s to 3 then the G’s to 4 then the H’s to 5 and then the I’s to 6. In my opinion, using an interval scale from 1-6 to rate color with 1 being the best and 6 being the worst color is much more clear and simple than using letters of the alphabet starting with D to represent color, so that is why I made this change in the data-set.

Finally, I copy and pasted all this new data into RAW. I chose to use a scatter-plot to analyze and present the data.

dh


The X-Axis of the scatter-plot corresponds to the weight of the diamond, in carats. The Y-Axis of the scatter-plot corresponds to the price of the diamond in Singapore dollars. The size of the radius of the data points corresponds to the color, where the smallest data points have a color rating of 1, which means that they are the best color. In other words, the smaller the radius of the data point, the better the color and the bigger the radius of the data point is, the worse the color is.  The color of the data- points correspond to their clarity (presence or absence of minute flaws). In the data-set, IF means internally flawless. Below IF, the second best clarity is VVS1, which means very very slightly imperfect, then VVS2, then VS1, which means very slightly imperfect, and finally the worst clarity is VS2.  I created a blue color scheme to portray clarity. The brightest blue represents the best clarity (the IF), and the second brightest blue represents VVS1, then the third brightest blue represents VVS2, and so on until the worst clarity is associated with the lightest blue color of the visualization.

I love my visualization and I am very proud to have created it. I think that it is the best visualization for this type of data, because the most interesting component of the data is the weight of the diamond vs the price. This visualization shows me that generally, as the weight in Carats goes up, the price of the diamond goes up. This is interesting and it shows me that weight is really the biggest determining factor of price. Weight matters much more than color and clarity when determining price, because the size and color of the data points (corresponding to color and clarity, respectively) fluctuates over the entire graph. However, there seems to be a strong positive linear relationship between price and weight of the diamonds, as seen in the X and Y axis.

Another very interesting thing that the visualization shows me that I never noticed in the data was the fact that the diamonds with the best clarity as generally the smallest diamonds. I can see this because the brightest blue points are clustered near the bottom left of the graph, which shows that they are the smallest and cheapest diamonds. It seems that clarity decreases generally as size increases. This makes sense because the bigger a diamond is, the more space there is for imperfection.

Another interesting thing that I noticed in the visualization was that all the outliers (the points that do not strongly adhere to the positive linear relationship between weight and price) are all tiny data points, which mean that they are the best color. This shows me that diamonds with exceptional color can be sold for more than they are worth from weight alone. So even though weight heavily determines the price of a diamond, it appears that diamonds with amazing color have the ability to be sold for more than their weight is worth.

Week 3- LA Control Panel

I chose to analyze the data set “Budget vs. Actuals” by the LA Controller’s Office. This dataset allowed me to compare the budgets allocation for each Department’s expenditure accounts to their actual expenditures. The data types for this dataset include the Budget Fiscal Year, the Department Name, the Total Expenditures (in dollars), the Total Budget (in dollars), and the Account Name. In this data set, the budget fiscal year is 2016. The fiscal year for Los Angeles is July 1 2015 to June 30 2016.

These data types create a record that aims to highlight the disparity between a department ’s budget and expenses. It aims to exemplify how money was meant to be spent, and how money was actually spent. Each record includes the budgeted dollar amount per department , and then the actual money spent by each department . It shows us how careful some department s are with money and how careless other department s are with money. Because we all live in LA, this dataset is personal to us as citizens because a lot of this money being spent comes directly from taxpayers.

screen-shot-2016-10-16-at-2-48-21-pm

In “Local- Global: Reconciling Mismatched Ontologies in Development Information Systems,” Wallack and Srinivasan define ontologies as data systems that “essentially share infrastructure for individuals to function as a group”(Wallack and Srinivasan 1). In other words, ontologies serve as a link between different groups and between the group and the individual. Ontologies also “work to create and enact worldviews within the social group and situate knowledge within the organizational or community setting”(Wallack and Srinivasan 1). The dataset which I chose to explore portrays an ontology pertaining to the budget vs. the actual spending of various departments within Los Angeles County. This ontology would be classified as a meta- ontology because it is created by the state, yet the data is very confusing to read and understand by the ordinary citizen. It took me a while to figure out how to use and understand the data because there were a lot of confusing terms for people not involved in finance.

Because of this, this ontology makes the most sense from the point of view of a city official responsible for creating budgets for various departments within Los Angeles. This person would examine this ontology to determine which department should have more or less money in the budget, and adjust budgets for the following years accordingly.

This dataset does a great job at portraying visually the disparity between the budget and actual spending of each department within Los Angeles. It tells me that many departments either have no care about the money they spent, or had extenuating circumstances which forced them to spend a lot of money they didn’t have. For example, the biggest disparity between budget and expenditure is from the Department of Water and Power. They spent $11,231,703,314.55. Their budget was $0. This enormous spending of money is confusing- why did they spend all that? Why was their budget $0 to begin with?

Wallack and Srinivasan argue that, “While any group’s ontology is unlikely to match that of every individual within the group, the extent of mismatch tends to increase with the scale of the group and the differences between the purpose of individual and group ontologies” (Wallack and Srinivasan 2). Specifically, the meta-ontologies created by the states lose a lot of local context and important information pertaining to individuals and district communities. The ontology loses its humanity- it becomes a record that is so broad and vague that individuals lose their voices in it. It only illuminates a small department of the population and leaves out a lot of individual voices. In terms of this specific data set, the most important component of this ontology which gets left out is its relationship to the individual. We have no information about how this spending and over- spending of budgets directly affects the individual. Perhaps because so many department s over spend, the individual tax rate goes up, causing financial stress and burden on many individuals. Furthermore, another huge question that I have after examining the data set is where does the money come from that the department s have over- spent? Because so many department s went way over their allocated budget, where did they get this money from?

From the point of view of a government critic, I would use this dataset to highlight the incredible amount of spending that goes way over the budget prescribed to each department . There has been a tremendous loss of money by many of these departments- money that was not even allocated to them in their budget. I would ask where this money is coming from. If it didn’t come from their budget, where did they get it from? Are they contributing more to the debt that the state is in, or are they using money from other budgets or places that the public is unaware of? I would view this ontology with a critical eye- I would think that many departments in Los Angeles don’t know how to manage and balance their spending and I would assume that the county is in great debt because of it.

Week 2 Blog Post- Bonnie Cashin

The relationship between recorded events and historical stories has been extensively studied. Hayden White presents an interesting standpoint of what this relationship actually is. He begins by defining events. From all the things that happen throughout history, an event is defined by what the narrator seems to be significant and chooses to remember. Events only become history with the presence of narrative, which is formed by the stringing events together. These events are strung together through the notion of cause and effect. In other words, narrative is created given the notion of what is important to us and how the world works. One event causes another effect, which causes another event, and so on. Because we need to have some idea of how the world works to use this cause and effect, we have to lean on our notion of how the world works to connect facts together.

This concept can be applied to all historical events and narratives. I chose to discuss the Bonnie Cashin collection of fashion, theatre, and film costume design (1913-2000). The finding aid for this collection describes and details the organization and contents of this collection and helps establish a historical context for this collection. This specific collection includes Cashin’s design illustrations, writings on design, contractual paperwork, photographs of her designs, press materials, and personal photos and letters.

If I were to write a historical narrative based on materials in this collection, I would begin with a story of the biography of Bonnie Cashin. Bonnie Cashin was born in Fresno, CA in 1908. She was interested in fashion and costumes beginning in her teen years. She briefly studied drawing in Los Angeles. Bonnie then moved to New York in 1933 to design costumes for the Roxyette dance-line, while also studying drawing in New York. She then quit both these jobs and began designing film costumes for Fox. Cashin eventually left Fox and began designing clothes and accessories for a popular clothing brand. She eventually gained public fame during this time through her efficient use of technology within the fashion industry and was considered a pioneer of sportswear. She then began working with another clothing brand until the launch of the Coach handbag company. She designed for Coach for 13 years and her designs are currently still in production. After her Coach years, she continued designing for other companies, and created another company of her own, The Knittery. She didn’t have any design assistants and received numerous awards for her work. She also founded a non-profit organization to provide funding for design prototypes.

The materials present in the archival collection reflect this biography. The collection is organized chronologically and includes design sketches from all the companies she worked for, as well as some of her personal items. For example, the collection begins with early costumes, then dance- wear costumes, then film costumes, etc.

Based on this information, I could create a narrative of the professional life of Bonnie Cashin. I could speculate that the time period she was designing for had no other influential sportswear designers and had little access to technology. Perhaps her sportswear was so influential because she lived during the post- war era, following World War II. Her designs may have appealed and catered to the women of this era through the practicality and comfort of sportswear. I could describe Cashin’s legacy as one of the most influential designers in history because her designs strongly influence and are present in mainstream fashion today.

Based on the information in the finding aid, I could also describe Cashin herself. First, she seemed to get bored of companies easily and enjoyed changing directions in her career. This is obvious because she had a multitude of employers. She also seemed to have a variety of interests from basic drawing, to sportswear, to clothing, to accessories. She was also very technology oriented, which shows that she was future- driven and attempted to change the way things were done. Finally, she was generous and sought to help future designers through her non-profit organization.

My narrative would have a few pieces missing if it were based entirely on this collection. First, it is unclear what kind of drawing Bonnie studied at art school. Perhaps Bonnie may have wanted to be a different kind of artist at one point in her life, but something pushed her into fashion specifically. Exactly what pushed her into fashion over other types of drawing is not included in this finding aid and would be missing from my narrative. I might remedy this by offering my own opinions of why she pursued fashion, or finding other resources to examine.

Next, something missing from my narrative is why Cashin left her job designing dance wear and began working at Fox. Something must have spurred her to leave dance- wear and begin creating film costumes. Because narrative is based so strongly on cause and effect, as White explained, my narrative would be incomplete without knowing the cause which effected her to begin designing at Fox. Furthermore, it is unclear why she then chose to leave Fox and began designing ready to wear clothes for other companies. I also don’t know why she stopped designing for her own first company, Coach, and went back to designing for other companies. This seems strange because she went from being the Creative Head of her Coach to designing for other people again.

Next, it is unclear what kind of technology she used within fashion. I would do more research on technology within fashion to accurately portray her narrative.

Finally, within the arrangement of documents of the collection, I noticed something called “Ford Foundation trip to India.” This trip was not included in the biography of the finding aid and it would be missing from my narrative because there is no context or information about it.


Blog Post 1

For this assignment, I chose to analyze Photogrammar. This is a web based platform created to help the public visualize life in the United States from 1935-1945, the time known as the Great Depression and World War II. Photogrammar consists of thousands of photographs from this time period and allows a glimpse into a very different era of the United States. This Digital Humanities project has exhibit, map, timeline, and data visualization components. It is part exhibit because it contains primary sources in the form of photographs that are categorized and made for people to encounter. It is part map because it has an interactive map showing photographs from different locations. It is part timeline because it allows users to explore photographs within specific time periods or specific years. Finally, it employs digital visualization methods through its various tools for exploring the photographic collection.

The source of the information used for this project consists of historical photographs from the largest photography project ever sponsored by the federal government. This photography project took place from 1935-1944. The project was founded after President Roosevelt created the Resettlement Administration, a relief- based government program, in 1935 in order to aid the poorest third of farmers displaced by the Great Depression. This stirred up a lot of controversy from the general public. In order to gain support for this program, the Historic Section within the Information Division of the RA set out to document America through photographs to show the public how vulnerable and unhappy some people were, and why the Resentment Administration would help many people. The project was moved to the Farm Security Administration- Office of War Information in 1937. The FSA-OWI produced many iconic photographs and included many famous photographers. The negatives were sent back to Washington DC and became known as the FSA-OWI File. The entire collection has 170,000 photographs from 1935 all the way up to 1946.

The processing of the photographs involved  digitizing them in order to be fed into a computer and made computationally operable. They were digitized by scanning the physical photograph prints into a computer.

The project is presented in a two different ways. First, the photographs are displayed on an interactive map created by Leaflet, which is a JavaScript library for interactive maps. CARTO is also used with attribution. The interactive map has the option to allow users to view the map by “Counties” or by “Dots.”

The “counties” option breaks apart the photographs by which county they were taken in. Each county is presented in a varying shade of green. There is a timeline at the top of the map which allows the user to choose which year(s) of the photographs the user wants to explore. There is a window allowing the user to choose which photographers’ photos to explore.

screen-shot-2016-10-02-at-5-32-10-pm

The “dots” option breaks apart the photographs by the photographer who took them by including a color coordinated key. This option also has the same timeline and photographer pop up option as the counties option.

screen-shot-2016-10-02-at-5-39-59-pm

Both the Counties and Dots maps also have the ability to show the 1937 Vico Motor Oil Map alongside the photographs.

When the user clicks on the county or the dot, he/she is taken to a page with all the photographs corresponding to the location or photographer they choose to see. From this page, the user can click on a specific photograph and find an enlarged version, a caption, a photographer, the date taken, the specific location, the classification, lot number, and call number, as well as similar photos.

The second way that the project is presented is through the use of three different Photogrammar Labs. These are extra tools for exploring and interpreting the huge photographic collection. One of the labs is called Treemap created by Paul Vanderbilt in 1942. It is a 3-tier classification system that begins with 12 main subject headings, 1300 sub- headings, and then sub- sub headings. This allows users to explore the photographs based on the content of each photograph instead of the location or photographer.

screen-shot-2016-10-02-at-5-41-42-pm

The second lab is called Metadata Dashboard and allows the user to discover the relationship between date, county, photographer, and subject in photographs from individual states. This dashboard is still in development and only California is available to view. This is really cool to explore because you can click on multiple counties within California to view the data together, or explore only one county at a time.

screen-shot-2016-10-02-at-5-42-09-pm

The third lab is called ColorSpace and allows the view to explore the color photographs based on hue, saturation, and lightness. This feature is not developed yet and is coming soon.