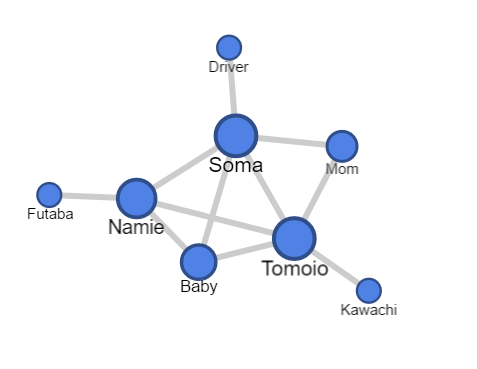
I created this chart in order to illustrate the interactions between various characters from the story Hush Hush Sweet Charlotte. For my character chart, the connections were made if the two characters either spoke or physically touched each other. Through this chart, I believe it will be easy to conclude who the main characters of the story were- Soma and Tomoio- since they had the most connections with other characters. However, other than that fact, this chart doesn’t really relay much information. Actually, the chart doesn’t even accurately portray who the main characters were in the story. Although both Soma and Tomoio did play a big role in the story, the story actually revolved more around Soma and the Baby with Namie and Tomoio playing the 2nd lead roles. This could potentially be solved by making Soma and the Baby’s nodes a bit bigger in comparison while also increasing the weight of the connection itself (maybe could be shown by changing the color of the connection). Furthermore, the presence of the sub main character in the story changed as the story continued; although Tomoio did play a big role in the beginning of the story, his presence was eventually replaced when Namie came into the story. This sort of information could be easily shown if we were able to show the node size and connection weight changing over time.