DH101

Introduction to Digital Humanities

Page 36 of 38

Blog Post 1: Salem Witch Trials Documentary Archive

Screen Shot 2015-10-05 at 9.03.00 AM

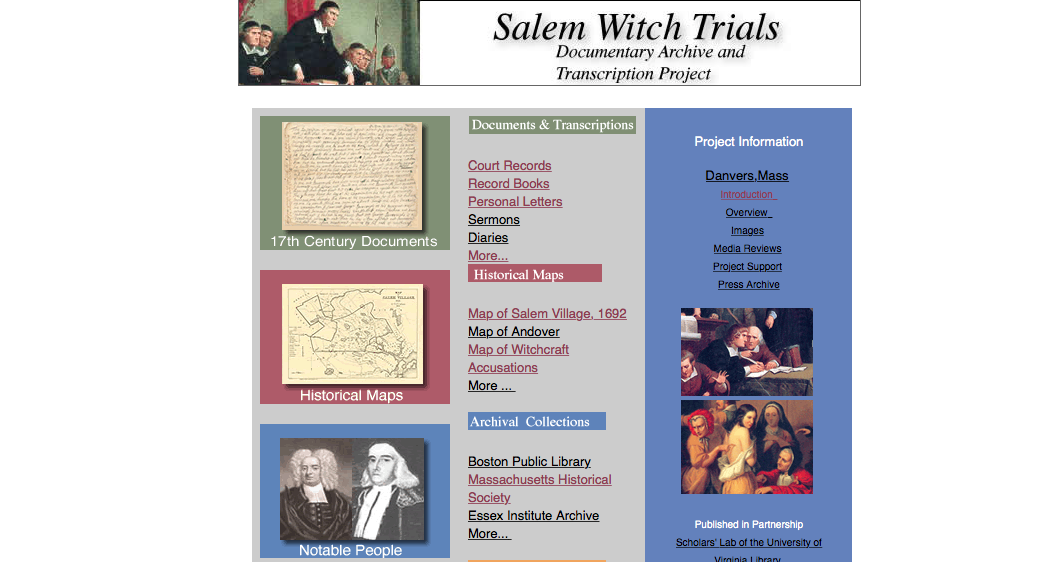
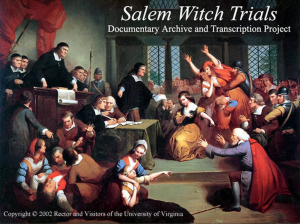
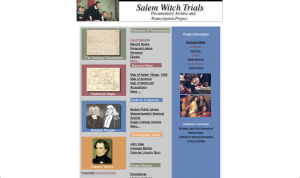
This week I explored the Salem Witch Trials Documentary Archive and Transcription Project. The website essentially serves as an archival collection for thousands of documents and transcripts (including court records, record books, letters, sermons, diaries, maps, etc) that were created during the Salem Witch Trials. The website has ultimately compiled a large amount of documents from the Salem Witch Trials; transcribed the documents from paper (or parchment) into a digitized form, and provided commentary on the various documents contained within the website.

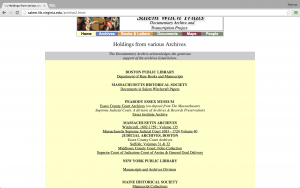
One of the biggest sources contained on the website are the various documents that were compiled from various libraries, including documents from the Boston Public Library. One of the most interesting sources that the website contains are the documents related to the accusations of witches. Further, specific maps of Salem have also been compiled and put into pdf formats which are available to be downloaded onto the users computer. The text analysis also serves as a great source since the individual who headed the project, Benjamin C. Ray, has actually thoroughly studied the religious influences that surrounded the Salem Witch Trials.

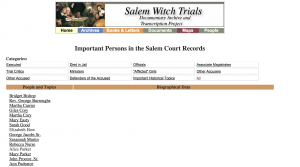
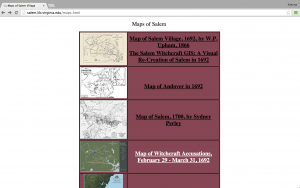
The sources were processed onto this website using a number of methods, including being organized, enhanced, digitized, and photographed. since so many sources are contained on the website, the creators organized them into the following categories: documents and transcriptions, historical maps, archival collections, and contemporary books. The document section includes court records, record books, personal letters, sermons, diaries, etc. The historical maps section includes a number of detailed maps of Sale in 1962, maps of the districts were the most accusations of witches were occurring, maps of Andover, etc. The archival collection provides a searchable database with notable individuals, such as court officials and pastors, during the Salem Witch Trials.

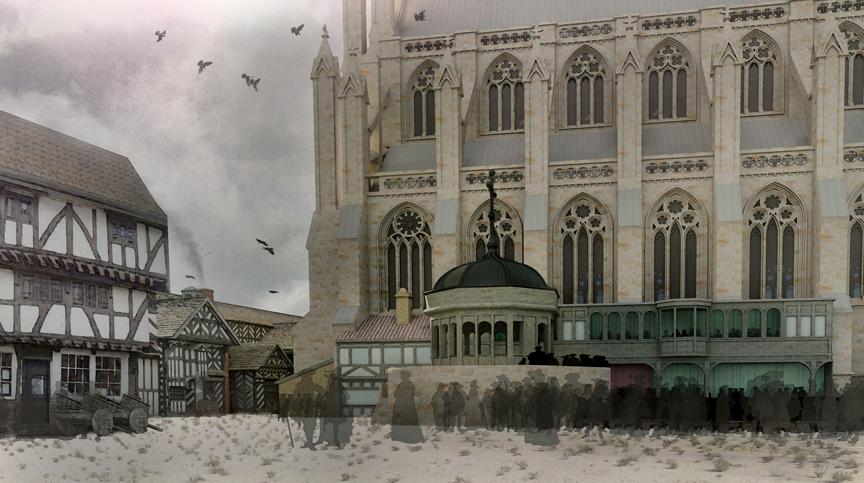
The website was overall presented in an okay manner. For the most part, the website lacks interactivity with the user, especially since it lacks a more visually appealing approach. Also, the website is not that user friendly because the link on the website are very slow and oftentimes do not properly load. The maps provided are, although detailed, basic in the sense that they are not interactive. One way to fix this would be to make the maps 3-D. One positive outlook on the website is that it is very well organized and easy to find specific sources because of the way the categories have been created.

Overall, the website does a great job of organizing the sources for the project although it lacks interactivity with the users of the website.

Reverse engineering Mapping the Republic of Letters


Screen shot 2015-10-04 at 9.08.17 AM

Reverse engineering Mapping the Republic of Letters

The Republic of Letters was an intricate network of correspondence between intellectuals of the Enlightenment. Mapping the Republic of Letters is a project by a team of students and professors at Stanford, who, in collaboration with international partners, seek to answer the questions of what these networks looked like, how expansive they were, and how they evolved over time, by visualizing these networks of famous intellectual correspondences. Their goal is to “bridge humanitarian scholarship and computer science by creating a repository for metadata along with guidelines for future data capture.”

Sources:
The data for this project is taken from the Electronic Enlightenment database, which is an archive of more than 55,000 letters and documents exchanged between 6,400 correspondents. The data also includes 20,000 letters that were written by and sent to 17th century scholars who lived in the Dutch Republic. The source material for the Intellectual Map of Science in the Spanish Empire 1600-1810 is the Diccionario histórico de la ciencia moderna en España Vol. 1 and 2. The project will also include a Salons sub-project, which will “construct its datasets from the mémoires of salonnières, the letters and journals of habitués, biographies of socialites, the columns of the Figaro, and the research of notable historians in French and European history agreeing to participate in the project.”

Process:
The data was geocoded, refined and linked to maps. The data was organized by collocation and affiliation.

Presentation:
This project features a combination: videos, images, maps, and graphs to visualize the networks across geographical boundaries.

One of the international partners is Circulation of Knowledge and Learned Practices in the 17th-century Dutch Republic. “CKCC created a web application called ePistolarium, visualizations of geographical, time-based, social network and co-citation inquiries.” In navigating through the ‘suggested tools’ section of our class page, I also found that Palladio was one of the tools used to process the data for the Mapping of the Republic of Letters. Other tools used are: Shuffle, Knot, Ink, Inquiry, Fineo, Priestley Timechart, and Corrizpondenza. A breakdown of these tools and how they process the data can be found here: http://hdlab.stanford.edu/tools/

I found the project to be too expansive, too multilayered, and not very user-friendly. The home page, for example, features one large image of the some of the intellectuals and their cultural contributions along with a timeline below the image. This could be a great way to enter the site via subject or date, but neither the image not the timeline are interactive or clearly legible. You enter the site by clicking on: Case studies, Publications, Teaching, Blog, and Contact. The Blog and contact options aren’t workable pages. Upon linking to Case Studies or Publications you see images of intellectuals, so one assumes you will be getting to the data via the network of correspondence by individual subject. But, the images include options for ‘Grand Tour,’ ‘Salons,’ and ‘Spanish Empire,’ which muddied and confused my expectations of how I was to navigate the site.

Reverse Engineering The Salem Witch Trials Documentary Archive and Transcription Project

The Salem Witch Trials: Documentary Archives and Transcription Project

Screen Shot 2015-10-05 at 1.50.49 AM

The Salem Witch Trials occurred from February 1692 to April 1693 in the New England village of Salem (Ray). The trials occurred when over 160 people were accused of witchcraft (Ray).  Most of the accused were jailed and many had their property and legal rights taken away.  Several people were tortured and executed.  The Salem Witch Trials Project is an online compilation of primary sources which were then transcribed to give a more comprehensive idea about this infamous time in history.

Sources: The collection consists of court records, contemporary books, record books, images of original court documents, diary entries, personal letters, sermons, maps, and images.  There were several different sources that contributed to this archive including books, museums, and magazines.  The seven main archives that the sources came from were Boston Public Library, Massachusetts Historical Society, Peabody Essex Museum, Massachusetts Archives, Judicial Archives Boston, New York Public Library, and Maine Historical Society.  The Documentary Archive part of the  project was supervised by Professor Benjamin C. Ray from the University of Virginia while the Transcription section was supervised by Professor Bernard Rosenthal from the University of Binghamton.  The site also includes a Project Support page that recognizes the organizations that funded or helped out with specific aspects of the research.  This includes the American Academy of Religion providing the grant to digitize the original court documents and the UVA SpecLab supporting developing the Salem Witch Trials timeline.  

Screen Shot 2015-10-05 at 4.54.43 AM

Processes: Several processes were used to create this collection and thus, the site can’t be categorized as one type of digital humanities project.  The site makes use of digital edition, timelines, mapping, and text analysis.  The site is indexed according to various archival collections.  There is also a transcription of the court records as well as scanned images of the original court records.  Everyone mentioned in the court documents is alphabetized while the notable people in the Salem Court Records are categorized into eleven groups which includes “executed” and “officials.”  By clicking on a name, the visitor is redirected to biographical profiles and images related to that person.  The archive also provides interactive maps of Salem Village and the locations of the houses of those involved in the trials, as well as Accusation maps that display accusations in chronological order, the locations of the accusers and accused, and the spread of accusations across Massachusetts Bay.  

Screen Shot 2015-10-05 at 4.35.11 AM

Screen Shot 2015-10-05 at 5.12.22 AM

Presentation: I was very confused by this site and spent a lot of time determining where I would find everything.  Considering the amount of great information provided by this project, I wish it was easier to navigate.  It also didn’t help that the database search wasn’t working so instead of being able to quickly find what I was specifically looking for, I had to go through several tabs to find the information.  Another aspect of the site that I didn’t like was the layout.  For me, it was confusing that the homepage was organized by rows and not columns.  And then, it was also confusing that there were main categories displayed on the homepage with subcategories beneath them that linked to material not listed underneath the main category.  For instance, under one of the main categories such as “Documents and Transcriptions,” the subcategories beneath it are “Court Records, Record Books
Personal Letters, Sermons, Diaries.”  However, when I clicked “Documents and Transcriptions,” it took me to “17th Century Documents” where the original subcategories weren’t immediately evident.

Screen Shot 2015-10-05 at 5.25.23 AM

The example that Francesca showed us in class of Pietro Mellini’s
Inventory in Verse, 1681 did a better job organizing its layout and even gave the visitors the ability to look at the original manuscript side by side with the transcription of the manuscript.  It would’ve been nice if this site had adopted the side by side method, however, in defense of the Salem Witch Trial Project, it was copyrighted in 2002 whereas the Mellini site was copyrighted in 2015.  Therefore, it’s no surprise that the Mellini site is much more advanced and modernized.

Overall, I would most likely not recommend this site to someone needing information about The Salem Witch Trials.  I would probably direct them to a more updated site that would be easier to navigate.  However, for an interesting read and for several first-hand sources, this would be a good site to check out.


Reverse Engineering “Virtual Paul’s Cross Project”

For this week’s blog, I went ahead and decided to take a closer look at the “Virtual Paul’s Cross Project,” a digital recreation of John Donne’s Gunpowder Day sermon conducted by North Carolina State University graduate students and professors. The site recreates all aspects of the sermon, which took place on November 5, 1622 in Paul’s Churchyard, London. When I say all aspects, I really mean all aspects–from basic aspects such as the physical layout of the courtyard, the sermon’s manuscript itself, to details such as the weather on that day, to the acoustics of the physical space, and (assuming) reenacted audio recordings of the sermon with varying audience sizes. The site truly serves as an interactive model for users to explore and immerse themselves in the event–creating an almost vicarious experience.

Churchyard-side-view-WWW1


Sources: First and foremost, the site sources from the original manuscripts of the sermon. This serves as the base of the project itself. From there, the site uses various pictures, sketches, surveys, and paintings to recreate the physical space where the sermon took place (the actual church burned down). For details such as the weather and other historical context, they sourced various published scholarly works to fill in any informational gaps present.

Processes: It’s definitely evident that the site utilizes Google SketchUp or some similar program to create a 3D model of the physical space. The modelers used sketches, maps, and photos as the framework for their model, and filled in the details by using textures and overlays typical of the 17th century. The acoustics were processed by sound engineers, who were able to create audio recordings of the sermon given various perspectives in the courtyard and audience size. I also believe the manuscript was made digitally available not the site as well.

Presentation:  The project manifests itself in this website where the user can interact with the 3D model, essentially walking through the physical space (digitally of course). The site also gives some (I’ll explain why only “some” later) context to the projects findings by giving secondary sources and proving anecdotes to the research process. The user is also given Youtube videos of different perspectives within the courtyard to experience both the visual and the audio of that day.

Critique: I love that the site focuses around the 3D model (its amazing, and if anyone has ever used Google SketchUp before, they’d know how much work it takes to get a model to look like that with so much detail). However, the organizational structure of the site is lacking. It’s very confusing to navigate through the tabs when looking for specific bites of information. Furthermore, the site skips over providing historical context in terms of what Gunpowder Day even is and its significance… and why the sermon was given in the first place. (If I missed this, feel free to tell me, though). Furthermore, I feel that the site looks a bit dated, aesthetically.

The Newton Project – Week 1

The Newton Project, created under Rob Iliffe and Scott Mandelbrot, is a site that collects, as well as publishes, the conglomeration of all of Sir Isaac Newton’s work since 2008. From the very writings that led him to his scientific fame to the religious and philosophical papers that were left unpublished, it is The Newton Project’s goal to uncover the incredible mind of Isaac Newton for all to see through translations and transcriptions.


The Newton Project Welcome Page

Screen Shot 2015-10-05 at 1.39.52 AM


Alongside the publishing of all of Newton’s written works, The Newton Project accomplishes in providing biographical information in regards to Newton’s lifetime, significant moments of his history,Screen Shot 2015-10-05 at 2.11.29 AM and even his perceived personality to the controversies that he instigated. Through this, the audience who peruse the site can not only just see t
he translated writings of Newton, but also gain a context in how these ideas were formulated.


Sources

The sources of the site were manuscript sources of all of Sir Isaac Newton’s written work, which have been gathered from private donors to a variety of libraries to the Cambridge University Press, all in which help the non-profit site. Many of these written pieces were Newton’s notebooks, correspondences, and even his religious interpretations of the bible.

Processes

In order to create the massive collection, all the sources were transcripted onto a web format from a hand-written entry, then cataloged with tags for a search engine, and putting them into a chronological table as well as an alphabetical list. Furthermore, each work is categorized into the four main subjects that Newton covered (Alchemical, Mathematical, Religious and Scientific). The texts are sorted by date to give a chronological timeline as to when the works were created and published by Newton, and documenting the metadata and source for each text. Lastly, Newton’s Latin religious writings have also been translated into modern English.

Presentations

The viewing of Newton’s works is provided in three different “settings,” such as “normalized text,” “diplomatic text” to “manuscript images.” All these viewings give the audience the opportunity to have a transcripted writings that can be highlighted or copy and pasted on a web-device that a JPEG image could not provide, yet still give the audience the option to see the original copy of Newton’s work prior to transcription. The search engine gives the audience the chance to also utilize tagging devices to improve their search more effectively and efficiently. The audience can be seen on a variety of levels from intermediate browsers to researchers of the historical field as well as those interested in the principles that Newton provide in the most original form.


Blog 1 – Reverse Engineering

The project that I am going to reverse engineer within this blog post is In 500 Billion Worlds, a New Window on Culture.  The project allows you to use an online database which enables you to type in an up to 5 word phrase and you can see how over time those phrases were cultivated, used in literature, and changed over time.  This scholarly algorithm has been used by many PHD students and even middle schoolers. For example typing the word “women” can show that up until the 1970’s modern literature did not put emphasis on feminism and readily classed the word  “men” more so than women.


wordcap-popup

The work’s algorithm can help you find out information in relation to sciences, math, and academic articles.  But it can also help you find out things like, Jimmy Carter was a much more widely conversed topic then was Mickey Mouse or Marilyn Monroe.  This research started back in 2004, before Google Books ever existed. The Leiberman couple who originated the project talked about the pressure and long hours that went into the project stating that,

        “We were exhausted,” Mr. Lieberman Aiden said. That painstaking work “was a total Hail Mary pass; we could have      collected this data set and proved nothing.”

The painstaking work of the couple did, however pay off, in that 11 percent of the entirety of published books has been added to Google Scholar and Google Books.  This includes over two trillion words used within Google Books, meaning the amount of phrases and word manipulations are endless.

Sources: The sources generally included most computational learning because of the need to code an algorithm for a strong enough site. Additionally the study and knowledge of old english and modern day dictionaries played a large part in analyzing words and phrases, and picking up on there origins, stems, and meanings. Additionally, this program was supported by the Foundational Questions in Evolutionary Biology Prize Fellowship and the Systems Biology Program (Harvard Medical School). Y.K.S. was supported by internships at Google. S.P. acknowledges support from NIH grant HD 18381. E.L.A. was supported by the Harvard Society of Fellows, the Fannie and John Hertz Foundation Graduate Fellowship, a National Defense Science and Engineering Graduate Fellowship, an NSF Graduate Fellowship, the National Space Biomedical Research Institute, and National Human Genome Research Institute grant T32 HG002295. This work was supported by a Google Research Award. The Program for Evolutionary Dynamics acknowledges support from the Templeton Foundation. Additionally many other grants and awards were given to the funding and knowledge of this project.

Processes: Culturomic analyses was used to study millions of books at once. The algorithm which was used utilized usage frequency and computed by dividing the number of instances of the n-gram in a given year by the total number of words in the corpus in that year. For instance, in 1861, the 1-gram “slavery” appeared in the corpus 21,460 times, on 11,687 pages of 1208 books. The corpus contains 386,434,758 words from 1861; thus, the frequency is 5.5 × 10⁻⁵. The use of “slavery” peaked during the Civil War (early 1860s) and then again during the civil rights movement (1955–1968).  The process to generate this algorithm focuses on historical precedence, and did not follow a new age approach.  History was the initial reasoning behind the project and in order to create a factual and intellectual algorithm in order to generate Google Books, the teams worked tirelessly to combine new age technology and knowledge of language.  The site understands German, Chinese, French, Hebrew, and Russian. Additionally the evolution of grammar had to be looked at in order to determine similar or same words from Old English to modern day language.

Additional Critique:  This highly innovative algorithm was a smart move on Google’s part in that the utilization and origin of words is common practice.  Books that are paperback are hard to come by in a digital age so fueled by e-books and such, that the digitizing of books both old and new helps the academic process along by making more resources readily available to both researchers and students alike.

Reverse Engineered: Virtual Paul’s Cross Project

Screen Shot 2015-10-04 at 10.04.11 PM

A recent winner for Best DH Data Visualization, Virtual Paul’s Cross Project  allows viewers to experience John Donne’s Gunpowder Day sermon as it may have been when originally delivered on November 5, 1622. This project digitally recreates an environment of where the sermon took place through a Visual Model of the cathedral and its churchyard. It also accounts for the audio of Donne’s sermon with full audio files, allowing for the exploration of Paul’s Churchyard as an acoustic space, and providing the audibility of the sermon. Lastly, the project contains other background information on the event, such as the occasion of the sermon, a biography of the preacher and the sermon’s script.

I would categorize this as a historical project, as the header on the website includes the date of the event as occurring in the early 1600s. Displaying the date clearly front and center indicates that this event was a significant moment in British history, worthy of the research and work put into this project.. An immersive development with many interactive user capabilities, this project definitely has some noteworthy attributes. Although it does have some minor facets that could definitely be improved upon, this project has certainly compiled and presented research on a historical event in a new and complex manner.

The Black Box of Virtual Paul’s Cross Project

The information presented in this project was taken from multiple sources. The most prominent source is a manuscript copy of Donne’s Gunpowder Day sermon. Images of various pages of the actual manuscript were taken and displayed within the project under the section entitled Sources for the Script. A full translation and transcription of the sermon’s script is also provided under the section entitled The Script. Additional sources for the research are listed under the Works Cited page, which contains the information for every primary and secondary source the authors of this project used—including various books, essays, and more.

Screen Shot 2015-10-05 at 1.41.49 AM

Virtual Paul’s Cross Project encapsulates a number of processes and services with the information and research the creators found. Viewers and users are basically allowed to virtually experience the preacher’s sermon as if they were actually there in London in 1662. 3D visualization models were created and are provided, which allow users to explore the physical layout/environment of the churchyard using zoom and rotate features. The creators also enlisted the help of an actor to record the sermon and sound the way John Donne would have on Gunpowder Day that users can listen to. More digital blueprints and layouts for the structural and acoustic features of the building are provided, along with other relevant images and sketches.

Screen Shot 2015-10-05 at 1.42.51 AM

Screen Shot 2015-10-05 at 1.44.02 AM

The final presentation of the Virtual Paul’s Cross Project is clearly put into a cohesive website that categorized its different services by tabs and dropdown pages, which lead to easy navigation for the users. The project also has a consistent header with a photo of the church and written text reminding users what they are exploring: “A Digital Re-Creation of John Donne’s Gunpowder Day Sermon.” Lastly, they embed their various visual tools/models within their pages breaking up huge blocks of texts (which may be considered as more aesthetically appealing).

Some minor faults and matters I noticed and disliked mainly just had to do with the project not explicitly saying why what it meant in context to history. Why this particular speech by this particular preacher on this particular day? Perhaps, I just needed to do some more digging to find the answer to that question but I wish it were just easier to find. However, all that aside, I conclusively believe that Virtual Paul’s Cross Project certainly well-encapsulates the three different layers that compose a completely developed DH project and very much deserves the recognition it has been awarded.

Reverse Engineering: Mapping the Republic of Letters

Mapping the Republic of Letters is a digital humanities project created by Stanford University. This project analyzes the communication records of notable figures in history, and collaborates the connections in a social network. It is described as the “old fashioned way” of simulating today’s online social media or a LinkedIn. This project visually displays the analyses of the raw data.

Screen Shot 2015-10-05 at 1.10.26 AM

<u>Sources</u>

The sources of Mapping the Republic of Letters are the physical letters written between the figured noted, as original sources compiled from Stanford’s research partners, credited including the University of Oxford, Groupe D’Alambert, CKCC, and DensityDesign Research Lab. This information is found on the homepage of the project site.

<u>Processes</u>

Mapping the Republic of Letters organizes the set of data in a number of ways to show multiple connections between the figures. Initially, all figures are listed individually as a “case study.” As each “case” is selected, an in-depth description and overview is provided. The project has interactive components in which the user can select what type of connections they want to see. By clicking on each person’s network correspondents, filters are available that show specific people, years, and what letters were sent, along with a physical map to show locations and time. Sociograms are also available to show the network. In addition, each case study includes a breakdown of how the visuals were created, giving visitors the power of recreating similar projects or visuals as they wish. This project falls under the historical category, as it maps scientists, philosophers, and other notable historical figures with a timeline and map. Its contributions are valuable in the sense that we can analyze trends, possible explanations, or fill in gaps of undocumented history by looking at the connections between people.

<u>Presentation</u>

This site itself is rather difficult to navigate. At first glance, the content of this project is not clear. It takes more than a few clicks to understand how the data set is organized. The actual networks and analysis are hidden deeper into the page, and initially, only the figures’ names are displayed. For this reason, the design of the actual site may not be best. However, this project unique as it does many things that printed work cannot accomplish. Mapping the Republic of Letters enables users to see multiple variations of connections via filters provided in the interactive portion. Personalized side by side comparisons cannot be created with this much strenuous amount of data available.

Deconstructing Virtual Paul’s Cross Project

Virtual Paul’s Cross Project goal seems to be creating a multi-dimensional experience of Preacher John Donne’s  sermon for Gunpowder Day. The website uses 3-D models of the church grounds, descriptions of the weather, acoustics, and social environment, as well as recreations of the actual speech to create an all encompassing virtual experience.

Screen Shot 2015-10-05 at 12.44.14 AM

The sources used can be partially found within the work cited tab. The primary sources listed are the actual manuscripts from the speech and records from the Church of England. The secondary sources include various works on John Donne and 17th century England. Actual venues are also included in as a source in addition to another very broad category entitled setting, which is broken down into subcategories. The broad array of sources that includes everything from almanacs to books on Shakespeare’s Theatre  provides the context to a very the specific event.

While a many of the sources were clearly laid out, what was more difficult to find was how they were able to get the recordings of the sermon and how they built their website. Because there was no information on either, I’d assume that the recordings were original recreations and the website was either built from scratch or through a framework similar to wordpress.

The process used in this project was creating a structured website that features various components and background context. A lot of the process seems to involve digital architectural tools to create sketches of the church grounds as well as providing the acoustic quality information in spaces that no longer exist. Some video editing tools must have also been used to show the building models as video links. Other possible processes could include audio tools to recreate the sermons and the simulated ambient sound, as well as transcription could of been used to present John Donne’s sermon. The Process of research is also very apparent in the background information found about the setting, culture, and John Donne himself.

The project was presented in a website with clear and simple category tabs, possibly as to not overwhelm if it had a database or a encyclopedia list format. All imagery was embedded in scroll down posts, as opposed to a grouped gallery view. I’m not entirely sure why they chose to present them in that way. Possibly to remain consistent with all the other categories of information that didn’t focus on models. Overall each separate web page within the site had a manageable amount of information on it.

Overall I thought this project was very informative, user friendly, and successful in it’s goal in taking the website visitor as much back in time as possible with accessible information. My only complaint is that  regardless of all the context provided in this project, the actual event, Gunpowder day, is not explained in a succinct way. I would probably have to google search is separately to find out what the day was about.  

Charles Darwin’s Library

Charles Darwin’s Library is a digital humanities project created by the Biodiversity Heritage Library. Some of Charles Darwin’s surviving books from his own library have been virtually reconstructed and formatted into a digital edition. The creators of the project focused on not only digitizing the books, periodicals, and pamphlets, but also transcribing the notes that Darwin wrote in the margins of these books in order to “retrace and reduplicate Darwin’s reading of a wealth of materials”. This digital collection has 541 volumes from 436 titles.

Sources:

The project began with original copies and surrogates of Charles Darwin’s personal collection of books from his own library that are now found in other libraries. In 1908, Charles Darwin’s son Francis gave away a part of his father’s library to Cambridge University, and so the Cambridge Library has provided the scans of 120 original books from Darwin’s library with all the handwritten annotations to this project. Some of the books from Darwin’s library have separated and were moved to different library collections. Some were available at The Natural History Museum, and they  have also provided with scanned surrogate imprints from their collections.

Processes:

The scans and copies of the books were digitally recreated, organized, and studied. Darwin wrote notes on his books, and BHL has typed up the annotations, making note of where he marked on the book and what he marked. BHL created a full transcription of all his annotations and markings.

Presentation:

The project is presented as an extensive online archive of books from Darwin’s personal library with a transcription pane for each page, detailing page numbers, line numbers, and the content of the annotations. It also provides index of subjects and concepts for those who are interested in specific topics from his library. There are also links to photographs of slip notes related to a specific marking in the book for further study. There’s a link to the Current Book List that lists all of Darwin’s books that have been digitally reconstructed and are available at BHL site, or you can click on the General Index to see the list of terms that have been used to classify Darwin’s annotations. By clicking on the term, you are linked to materials in the collection that are related to the term. Darwin’s books are also made searchable if you know what you are looking for. There’s not a lot of interactivity, except for the fact that you can navigate pages, zoom in and out, and click on links for more information about a marking or a scientific name. Charles Darwin’s Library seems to be more geared towards Charles Darwin fans and researchers who need easily accessible collection of his books for their studies.

« Older posts Newer posts »

© 2026 DH101

Theme by Anders NorenUp ↑