Weights of Boxes of Chocolate Frosted Sugar Bombs
I chose to visualize the Chocolate Frosted Sugar Bombs dataset that gave the weights of 10,000 random boxes of the Chocolate Frosted Sugar Bombs breakfast cereal using a Tableau Public bar graph.
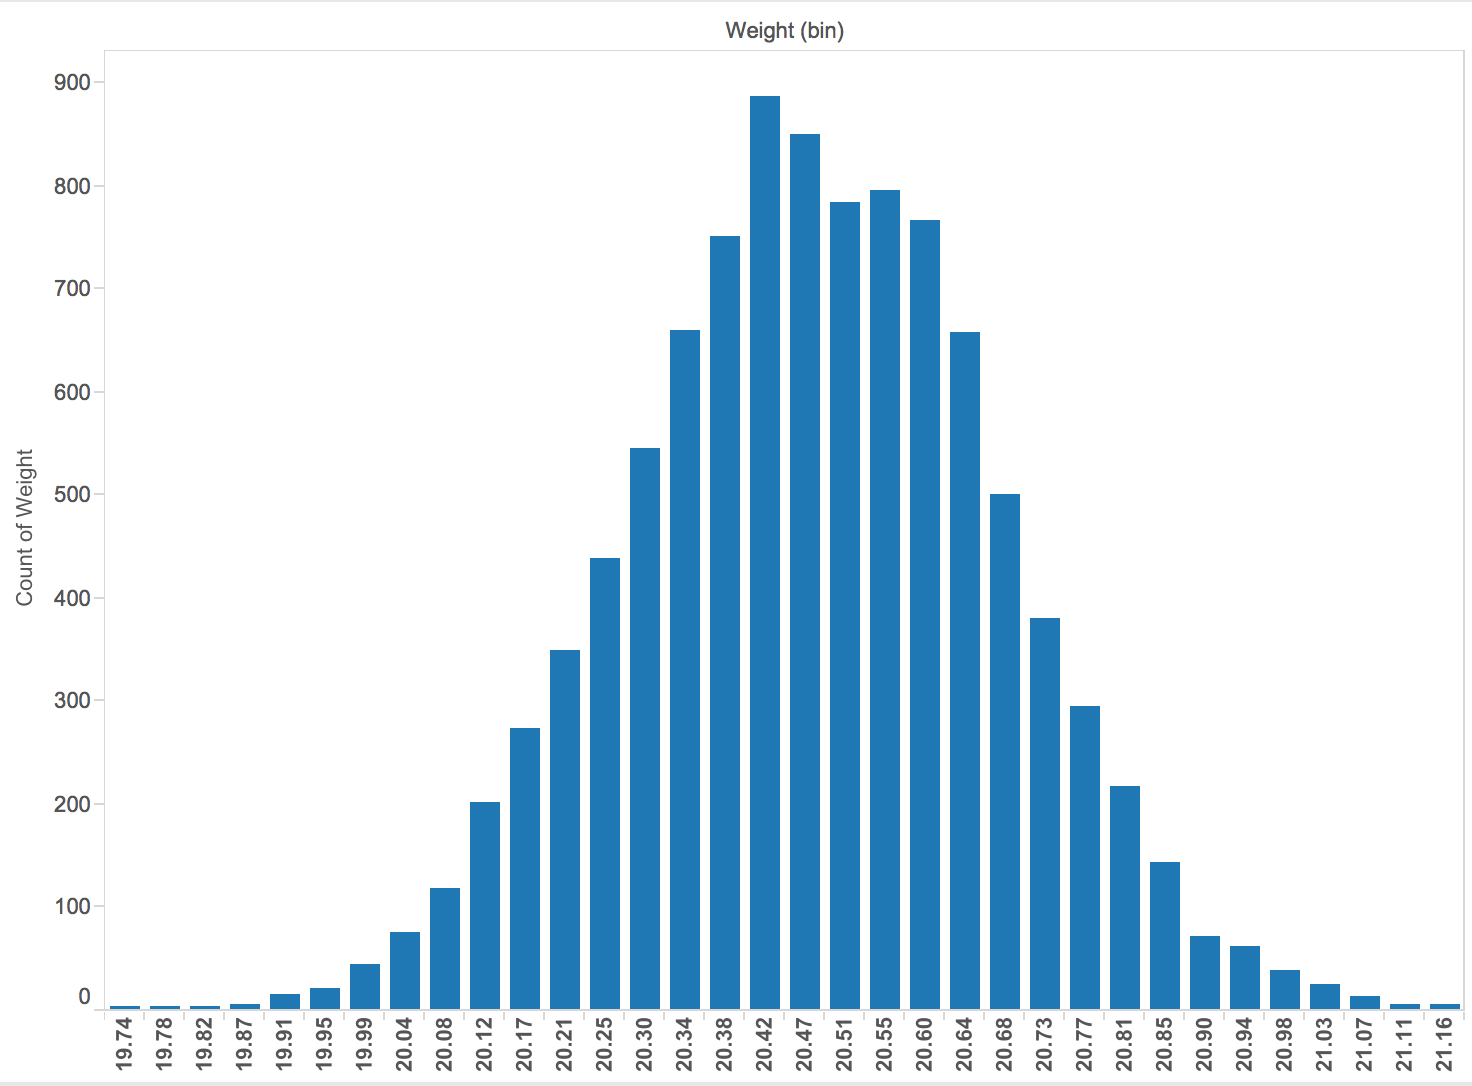
What does your visualization tell you that you couldn’t see from the data itself?
Just by looking at the dataset, there wasn’t much that could be concluded because the data itself is just a list of the weights that isn’t organized in any way. There is also a huge amount of data in this set with 10,000 weights, so the bar graph really helped in organizing all the weights (gives the count of boxes under each weight category) and visualizing the range, median, and mode of the data. From the data, I could see that the median was 20.45 oz , that the data was most concentrated around that area, 20.42 oz was the mode, and the range was 19.74 oz to 21.16 oz. I was surprised to see that 20 oz fell pretty far left of the graph because I had assumed before seeing the graph that 20 oz would be the median and the rest of the box weights would fall closely on either side of 20. Of course Chocolate Frosted Sugar Bombs are fictional, but it was also interesting to see that of the 10,000 recorded weights, there were only thirty-four different box weights. Of the 34 different weights, 27 of the 34 fell greater than 20 oz. It was also interesting that the creators gave such a large dataset and were specific enough to give weights rounded to the 100ths place for a fictional product.