The data set that I chose to analyze are the winning lottery number in Florida from 1988 to 2008. The tool that I chose to create this visualization was RAW. According to Yau, data visualizations are all about noticeable visual cues that impart information. The visual cues that are evident to this data set are color hue, position, and shape.
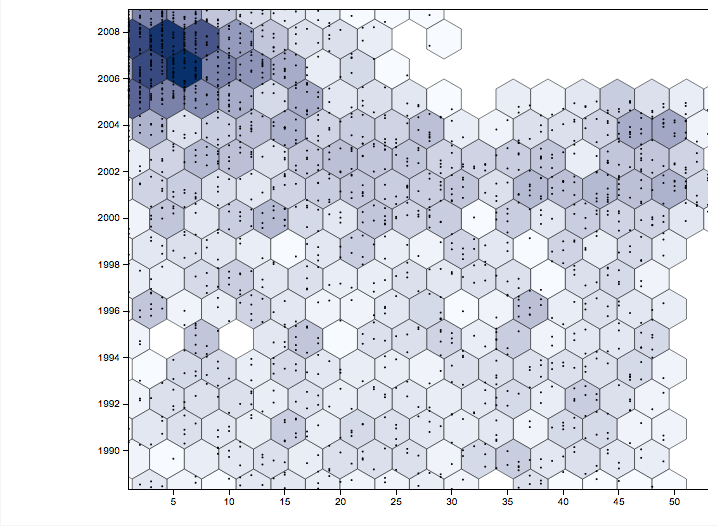
The most obvious visual aspect of this graph is the color hue. In RAW there were two coloring options, ordinal (categories) and linear (numeric). I selected linear because when the x-axis information (winning numbers) was considered categories there were too many colors that correlated with different numbers. Using linear, the color hue progresses darker with a greater amount of that number being a winning number during that year. The colors tell us that in the late 2,000 there were a lot of repeat lower digit winning numbers.
The position of this data visualization is harder for me to decipher than the color. There seems to be a clustering of slightly more hexagons and smaller dots by the darker colors. The similarity leads me to think that the position serves the same purpose as the color cue.
The shapes used in this visualization are hexagons. According to RAW, the purpose of the hexagons is to create a more comprehensible scatterplot, when graphing something with hundreds of points. The hexagons do make this visualization easier to read, however there are still smaller points within the hexagons and I’m not exactly sure what they mean.
Some of the visual cues broken down by Yau but not used in this specific data visualization are length, area, and volume. Because the data is not categorical length is not that appropriate of a tool for the lottery information. Volume and area could have possibly been used to show when there were a lot of the same winning numbers, but is probably not the most efficient way. There are many specific graph types that also would not make sense with this data, such as pie charts, bar graphs, or any other type that caters toward categorical data.
Overall what I learned from putting my data into RAW is that from around 2006-2008 there were the most repeated winning numbers and they were lower digits. The conclusion makes sense because single digits are more likely to reappear in a number sequence than double digits. Also there were more lottery numbers drawn in the more recent years than in the past.