I looked into the data base of street grades from the LA controller’s office. This data base ranks all of the streets of Los Angeles based on street pavement condition.
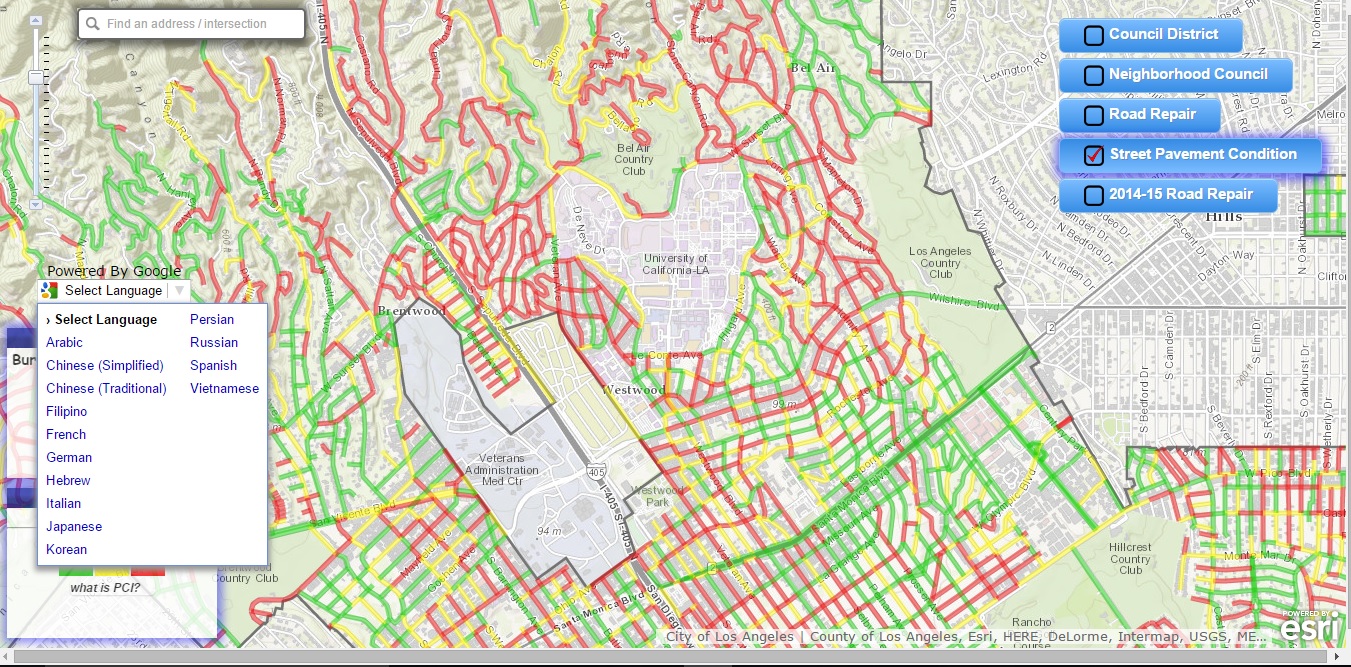
http://bss.lacity.org/NeighborhoodCouncils/Street_Assessment_Map/map.html
The data is a organized as a map that visually portrays the pavement condition A record in this data base would be the data of a street along with a PCI (pavement condition index) rating. Wallack and Srinivasan define an ontology as a group of data or information. The ontology of this data is a government sponsored rating of quality of the streets in Los Angeles. A view of this ontology would make the sense to someone who is working on a city budget for the city. This way one could determine where resources should be allocated based on need. For efficiency one could also searched for contracted street cluster that the city should take care of.This data shows phenomena like what general areas have streets with better or worse street condition.
One of the major issues that I see with the chart is that it is government rated. This means that the condition of the street is biased. Also, it lacks a way to measure street usage/popularity. Without a tool like this the city might send resources to fix a street that is in poor condition even though it may not be used by anyone. That being said, another set of data that would be useful is a tally of pedestrian complaints of streets to know what streets mean most to people who use the streets. I think that a tool like this would help the government, who are most likely the ones that are using the data to make decisions that effect an entire city, to know where resources she be relocated and the amount needed in order to improve efficiency.
I think the if I were to start over with data-collection, I would continue to survey they streets on standard that would include both the street condition . I think that way, the data would be more true to the people in terms of their point of view. That being said it would be important to survey everyone who uses the street. This way the data is altered by biased feelings. I might also track at what times the streets are busiest so that the data might be more valuable in terms of when repair should be scheduled. In this way the data can help people by presenting information that is valuable to properly decide what the best course of action for the people who use the streets.