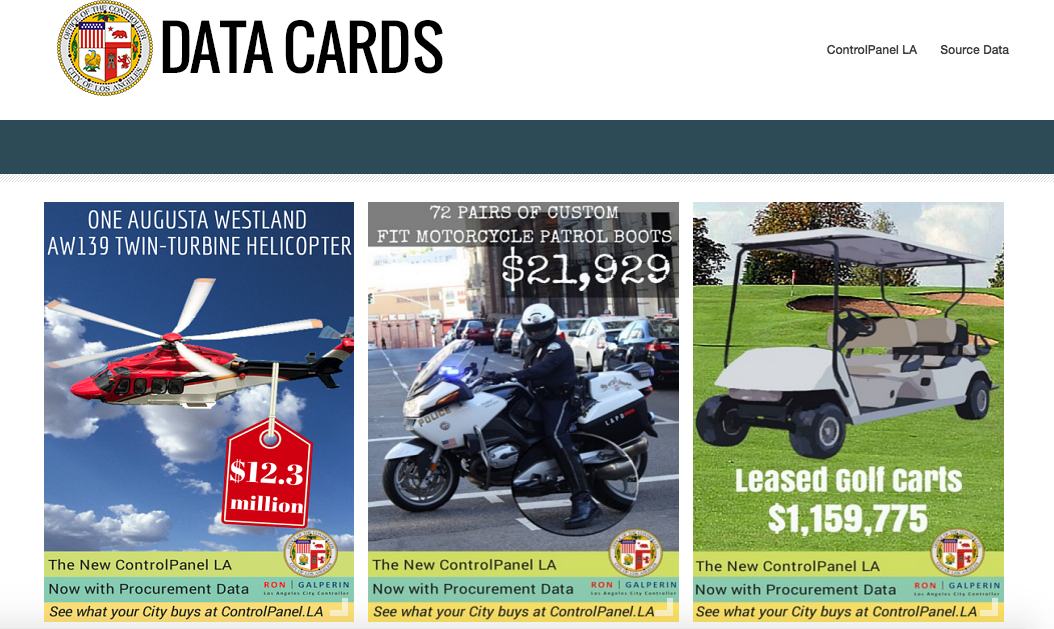
The dataset I chose to explore from the LA Controller’s Office was the What We Buy Data Cards. The cards provide data for the 15 items that the city of Los Angeles spends the most money on. These items are an AW139 helicopter, motorcycle patrol boots, golf carts, soccer balls, radar speed signs, basketball nets, ballots, thermoplastic paint, graffiti buster, TORO riding motors, Federal L.U.S.T. Tax, fire hoses, high visibility white traffic gloves, mops, and large frozen rats. The data cards in this dataset constitute constitute individual records. Each data card explains what the item is, how much they have spent on it, why they buy it, and a fun fact about the item. At the bottom of the card, there is a button that takes you to the control panel to explore the data even further. The spreadsheet provides specific data including the date the items have been purchased, how much it costs, the amount they bought, where they bought it and more. This data can also be visualized in multiple ways such as pie charts, timelines, and bar graphs. 
Wallack and Srinivasan’s definition of ontology is a “system of categories and their interrelations by which groups order and manage information about the people, places, things, and events around them.” This data set’s ontology is organized by the data cards. The LA Controller’s Office organized the categories by the individual item itself and within each category it dives into more depth about what/how/where the money was spent on that item. I think this ontology would be the most illuminating and useful to the curious eyes of the general public. The data gives a brief overview of some of the most outstanding purchases of the city without going in to extraneous detail. I think what this data set lacks is background information for why it chose the items it chose. To me, it does not seem like they are the items that LA spends the most money on because the data cards are not ordered in any numerical order. This ontology is categorized based on the view of the LA Controller’s Office, which chose to display very specific details about their expenditures. If the data was recollected and categorized into an ontology from a different point of view, different items might have been chosen to display expenditures.