Blog

Week 3: Open-source assisting storytelling

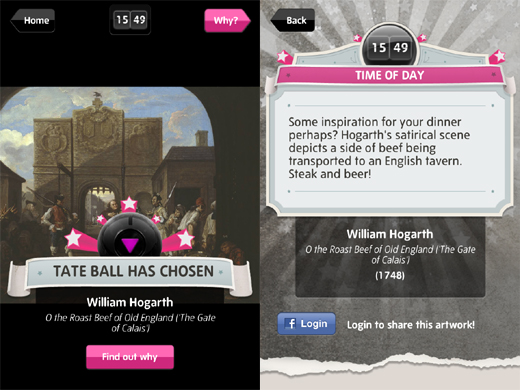
I remember back in middle school, before Wikipedia was seen as a more “legitimate” source, that my teachers would always warn us to “NEVER use Wikipedia!!!”. I don’t know one of my classmates actually followed that rule, but in the seven-ish years since middle school, there has been a drastic outlook change on Wikipedia, the world’s favorite open-source encyclopedia. As Wikipedia celebrates its 15th year, you can tell how institutions have seen the success of Wikipedia and begun to understand the importance of having open source material available for an increasingly Internet-centered society who has a greater demand for open source content, as mentioned by Mia Ridge in her article. Multiple institutions, such as the Tate Modern and even MIT have posted countless material on the Internet free for public use, and that has begun to transform how we are able to consume and apply knowledge.

One way you can see the impact of Open Source is in the creative industry. While it may seem like they are just copying their predecessors, without open source or copyright free material, it has actually increased creativity, especially as new platforms, such as YouTube, increase in dominance. For instance, The Lizzie Bennet Diaries, is a popular spin off on Jane Austen’s Pride and Prejudice, which is open source. But, they were able to apply it to a cohesive digital storytelling plan (explained here by Joe Lambert) and give it its very own life. It is not like the 1995 BBC adaption, nor the 2005 movie, which are direct adaptations. It took the main themes of Austen’s novel and applied it to the 21st century, and delivered it through a medium that worked  with the platform it was presented on (vlog-style episodes on YouTube). The creators were able to take advantage of the open-sourced material, and meld it together with the different aspects of digital storytelling to create something not quite seen before.

Week 3 – Renderman Open Sourcing

In the article, “Where next for open cultural data in museums?” written by Mia Ridge, Ridge explicates the recent demand and openness of cultural data projects as well as the numerous effects that follows such transparency. Something from the article that interested me was the potential use of a museum’s cultural data for creative use through Creative Commons. Although museums most likely intended that artwork images be shared for the sake of sharing and learning, the article pointed out how artist can take the data and repurpose it to create new meanings — regardless of whether or not that is a good or bad thing.

This utilization of open data seems, to me, much akin to when a program suddenly opens its use to the public for noncommercial purposes– in this case, I am reminded of the release of Pixar’s Renderman application. Pixar, known for its immense animation, utilizes this program to speed up rendering time with just as perfected quality. The fact that they have released this technology to the public is no secret.

Ridge articulates this tension between allowing certain parts of data be accessible for others to use for their own personal work; yet, the importance of distinguishing a “more sophisticated data structures and specialised vocabularies to support internal uses, partnerships between museums, libraries and archives, or for use in research-led projects.” Pixar holds this similar distinction by opening up a noncommercial free version of Renderman while keeping the most up-to-date technology saved for themselves to create the animations we see on the theaters. Likewise, Ridge explains how “many museums are making lower resolutions images available for re-use while reserving high resolution versions for commercial sales and licensing.”

I personally agree with this distinction and classification of materials. By making certain portions “off-limits,” it demonstrates that the artwork or program as more valuable than if it were to be given away freely, respecting the artists who’ve shared their work.  Ridge ends her article concluding that in the end, open data has to potential to expand knowledge and stimulate innovation — just as Pixar’s Renderman application has the potential to advance progressing animators.


Week 3

Looking at this week’s readings the thing that stood out to me the most was the contrast in the presentation and purpose between the Cooper-Hewitt and the “I cannot make bricks without clay visualizations”. While they both have a somewhat similar purpose in that they were created to look at the change in color usage over the years, the presentation was widely contrasting. I think despite shortcomings in both, the Martin Bellander tumblr post was more successful in that he explained what he was producing. With the Cooper-Hewitt post I was left with a feeling of so what, it’s all fine and dandy to make a visualization, but if it doesn’t really say anything on its own you should probably go to some effort to explain it. I think perhaps the point might have been for viewers of the post to noitce trends on their own and come up with their own observations, but the visualizaton to me seems flawed in that nothing really jumps out to me as partcularly notable except perhaps the recurrence of brown and green in the 1940’s. With the Bellander visualization he stated an observation towards the trend of the growing use of blue and he presented several theories as to why that trend may have occurred. While the theories were produced through comments and thus cannot necessarily be relied upon, they show engagement with users on the visualizations. I think that visualizations can be great ways to look at data differently, like with the DH101 projects we did last quarter which includes the well made Tate project, but I feel like sometimes visualizations are made just to be made. With the Cooper-Hewitt viz I just feel like it doesn’t really say anything. Perhaps it could be used as a starting point to lead into more in depth research, but as it is I think data alone can’t necessarily be left unexplained. Though they might be made with the latest software and tech and they might look fancy, if a visualization isn’t being used to argue a point or act as evidence for the data they represent then they are merely decorative minutiae.

W3 – Challenges of Open Data on the Web

Last week we discussed new means of museum-viewer participation in the digital age. This week’s readings introduce another approach to the same challenge: how can today’s museums engage new generations with their wealth of cultural knowledge? If we understand the web as a fluid, albeit imperfect, medium for information creation and distribution, why not open source the data that forms the backbone of the modern museum?

In her article “Where next for open cultural data in museums?”, Mia Ridge argues that although “each open cultural dataset added to the web of data contributes to the wider network of content and knowledge and creates new possibilities for innovative experiences of our shared cultural heritage”, we have only just begun to unlock the potential of open cultural data. The key to doing so lies in the networked nature of the web: access, usability, and licensing.

Without easy access, open data on the web is no longer “open.” Although some records may require APIs and sophisticated data structures these containers may stand in the way of the layman and restrict use of the data. Therefore it is important for museums weigh all options in order to determine the best way to share their data on the web.

Usability is another important concern for open cultural data. I spend a lot of time researching tools, plugins, and libraries on Github when starting a code-based project. It’s amazing how often people publish their work as a gigantic codebase without a proper readme (documentation/reference). This “it’s all there, trust me” mentality should be avoided at all costs when sharing cultural data because it alienates users. Clear classification, complete datasets, standard formatting, helpful notes, and documentation/reference make it easy for users to access the data they need to create amazing content.

Finally, Ridge mentions confusing or incompatible licenses as reason for the under-use of open cultural data. Although museums may wish to restrict usage of data, it is incredibly important that their licenses are clear to users. Github makes it easy to add standard licenses such as Creative Commons or MIT to repositories.

Week 3 – Practicality vs Cultural Capital

I’m writing this response knowing that it’s not going to be a very popular view point, but I think it’s worth mentioning. Looking at the various types of data visualization for this week, I have to admit that some of them don’t quite make sense to me. I understand the point of visualization: to organize the data in a way that is easy to interpret, and easily presentable. So some of the projects, like the Cooper-Hewitt’s color history (while lacking an interpretation and meaning), or the Tatelet (which has no “data” purpose what so ever) fulfill their purpose well, but in a very abstract sense. But these data visualizations do not portray data in a practical way – they are the epitome of the “art hack” or the DH repurposing information.

Even more problematic for me are the visualizations of Helen Wall. These data visualizations have a clear purpose, and interpretation, as well as a very clear portrayal of information. (Theoretically, I shouldn’t have a problem with them at all.) Some of her graphs, however, don’t really need to be graphs at all. The artistbio’s by country graph doesn’t help me understand that information any better, in fact, it makes getting a finite number even harder. This, to me, defeats the purpose of organizing data. At that point, it feels like grasping for cultural capital. Like the image below:

Screen Shot 2016-01-18 at 6.09.05 PM

This is also a data visualization, but it portrays very little information if you do not understand the theory behind the graph that compacted a large amount of information into this small little image. It can also be replaced by a short explanation and a table that clearly communicates finite quantities, and ideas.

It’s not the idea of looking at information from a new approach, or reorganizing the data that I have a problem with. It is the bizarre obsession that we have with visualizations – why do graphs hold so much cultural capital? And why do “digital” approaches to information always seems to end in graphing information  when it is not more approachable or helpful to do so? Are there other ways to make information more digestible but relay just as much information?

Week 3: 120kMoMA – A data visualization study

Out of all the readings assigned for this week, the one I was most impressed by was Helen D. Wall’s “120kMoMA – A data visualization study of the MoMA collection dataset.” This article reminded me of our own digital projects we completed in DH 101 last quarter. The author did a great job not only presenting and explaining her visualizations, but also explaining her methodology and the questions and issues she faced along the way.

Wall said she got her data from MoMA’s open collection data available on GitHub. (This is an example of how the public uses open cultural data online posted by the museums).

Right off, Wall stated the purpose and importance of her independent digital project saying that by analyzing the dataset from a new perspective, examining features in a different way, by creating new categories and groupings, we can gain new insights about not only the artworks and the artists, but also about the institution which houses these artworks.

I think here it’s important to mention the concept of an “ontology,” which is basically how you interpret and categorize data. So, given the same data, different people can have different ontologies for that information, and thus, emphasize different properties and relationships of that dataset. Here, with the MoMA collection and Helen Wall’s project, it’s clear that the way Wall chose to organize the artists and the artworks is different from how MoMA had it.

After presenting several visualizations on artistbio, department, classification, creditline, and dimensions, Wall discussed the problem with categorizing these artworks. For instance, she brings the example of Frank Stella’s Kastura (1979) and Giufà, la luna, i ladri e le guardie (1984), both of which include oil paint and aluminum, yet the first one is classified by MoMA as a painting, and the second work is classified as a sculpture. Thus, Wall’s argument is that now especially with the increasing contributions of modern art styles, perhaps it’s no longer accurate to use the medium of an artwork as anchor for classifying a work as any particular type of art.

Open Cultural Data in Digital Apps

Reading “What’s Next for Open Cultural Data in Museums?” by Mia Ridge really intrigued me with the relevance it has on recent exposures or reformed licensing for creating digital applications. Ridge first explains what open cultural data is, being “data from cultural institutions that is made available for use in a machine-readable format under an open license.” While this allows much potential and possibility in how museums can use supplementary digital methods to better visitors’ experiences or understandings of the collections, open cultural data can also be misused by becoming digitized. Ridge says, “Open cultural data could be as simple as publishing a downloadable text file.” From one perspective, this is a great way of exposing cultural data to the general public, letting people use the content without any extreme repercussions that may come with copyright restrictions. On the other hand, Ridge also determines that some open cultural data is overlooked; obstacles resulting in this includes confusing licenses, poor record quality of data, lack of general interest, and overall ambiguous data.

The statement by Ridge reminded me of the projects we had looked at for Week 1, where we examined digital projects to get a grasp of how technology either adds or detracts from the experience museums are trying to create for visitors. My table was give the “TateBall” app for iPhone. Users shake a magic “Tate-ball”– the app calls upon temperature, location, and time of day to pick out an art piece from the Tate Modern museum. While pretty cool and does amplify the involvement of visitors at the Tate, my table had agreed that no educational purpose came from the app other than being introduced to art pieces we haven’t known about before. This then ties back into how Ridge is certain in open cultural data’s purpose being generally misunderstood by developers, programmers, and museums, as she later concludes “There is often a tension between the need for easy-to-use datasets using common vocabularies for simple ‘mash-up’ style applications and the need for more sophisticated data structures…  to support internal uses, partnerships between museums, libraries and archives, or for use in research-led projects.”

“…Open cultural data projects seem to work better when they set aside resources for community interaction…”

I definitely agree with her, since the digital app of the TateBall had potential in improving audience interaction, but didn’t deliver any resonance for it; it could be possible that the app developers used a dataset that only provided the very basic information about the Tate collections, and nothing further? Nothing about why these art pieces are housed in the Tate, where they come from, or why they were created is given in the app; users are left to either speculate about the app’s intentions, or they are left confused and gain little knowledge about the pieces, thus reducing the effect of resonance. It could also be said that perhaps an app like the TateBall does nothing to enhance experience; maybe it’s just the fact that it being digital detracts from the art, in this case, and therefore could detract from the great potential that the open cultural data had. All in all, open cultural data faces a huge grey area in how we interpret the data and decide to use it, as well as how our intent of opening it up- it’s very existence, even- to the public is called into question if delivery methods such as digital mediums aren’t effective.

Digital Storytelling- Week 3

The guidelines given by Lambert in the “Digital Storytelling Cookbook” reminded me of many narrative videos. The last one that I saw that follows some of the rules Lambert lays out was Prison Da Vinci No. 1 Painting With Skittles from TCOLondon on Vimeo.The video was part character story, part recovery story of a prisoner who paints using unconventional materials like skittles. The video is very successful in telling it’s story due to several factors.

One factor was the narration. The story is told by the prisoner himself, who at times has a very dramatic tone and cadence. The way he tells his story is also a little unusual. It is non linear and jumps from tangent to tangent. This factor deals with how the story was assembled. The creator of this visual project chose not to tell the story chronologically and to leave a lot of the context out. Some of the context, such as his status as a prisoner, his profession, and why he uses those materials are all left out, but are details that the viewer can easily be fill in through visuals. The editing, use of audio/interview, visuals really lend themselves to give insight to the painter is even if it doesn’t clearly lay out the story of his life.

The only guidelines given by Lambert that I do not agree with and do not see in the video is his interviewing technique. The interview technique he describes seems very specific and may not lend itself to every situation. I am in the video department of the Daily Bruin and find myself interviewing subjects in front of a camera often. I find that based off the type of person you are sitting down with has a lot to do with how you go about getting them to tell you their story. Some people need more encouragement and more specifically framed questions while others just need a vague topic to jump from and start talking.

If you’re going to do it, do it well- Week 3

I realize that the readings for this week were focused on data and metadata but I could not get passed the poor use of technology. Going through the readings I realized the importance of doing technology right. Just because something can be done, does not mean it should be done. The same can be said for museums an their collections. Technology should be integrated into the museum because it has a use to serve in the growing demand of the public. However using technology for the sake of using technology merely wastes time and confuses people.

The Cooper-Hewitt piece is one example. While the author may have approached the subject with a particular question in mind, he did not accomplish much; nor was he able to convey anything interesting to the audience. His analysis produced a table of colors but not much interpretation. For another example, the piece by Bellander has a topic in mind and interpretation. However he spends most of his article focusing on the code and the methods he used. While this is relevant, he does not keep his audience in mind focusing on concepts most would not understand or find interesting. Only later in his article does he actually get to the important interpretations. A good example of applied technology is the DH project on Turner. The project is clear and defined in the analysis and interpretations.

In the earlier two cases, the use of technology is poorly applied; an example of when people and museums use fancy technology for projects that do not need it. Technology should therefore be applied wisely and be used to extend or supplement the current collection. If the digital applications put forth by the museum are to frustrating and boring for the public, the technology will only hinder the exhibit. For example, audio guides can be either a hit or miss with some museums. The success and attractiveness of the guides depends on the script, choice of content, narrator, and the length of each audio clip. A guide that is long-winded, mono-toned, and boring will only discourage viewers from learning more about the museum and its collections. Curators and researchers should therefore use technology cautiously.

Week 2 Blog Post

According to Stephen Greenblatt’s article, “Resonance and Wonder,” we interpret history, just as we interpret works of art. The social practices that we study aren’t immediately accessible to us. We read about them. And their relevance to the present are not static either; the connection between the circumstances in which the text was written and our own are dynamic, rendering the idea of a “correct” or “valid” interpretation meaningless. Therefore, the key to interpreting historical texts or art is to contextualize the issue of interest, or more specifically, to make cultural connections at a given moment in both its history and our own.

Greenblatt argues that it is this contextualization of objects that leads to resonance, or the ability of an object to evoke cultural connections in the viewer. In order to contextualize displayed objects in museums, Greenblatt suggests that museums be more willing to get in touch with “aesthetic openness,” that is, share with the public details that show the object’s fragility – its wear and tear and state of imperfection that give insight into the circumstances in which the object came about.

Greenblatt’s idea of “aesthetic openness” reminded me of an installation that I saw last winter at the National Museum of Modern and Contemporary Art (MMCA) called “Home within Home within Home within Home within Home” by Do Ho Suh. It’s a life-size, fabric installation of the house where Doh lived when he was studying art in Providence, Rhode Island. By meticulously measuring every inch of the apartment where he was residing and making a precise and detailed cast of it out of fabric, the artist defined a “home” as one’s intimate, clothing(skin)-like space. The installation includes not so perfect hand-stitched door-knobs, crooked etches of Doh’s and his American neighbors’ names on the mail box, cracks in the windows and wear and tear of the Victorian facade – details that seem to reach out and pull the viewer into not only the embedded message or theme of the object but also the artist’s surrounding.