I’m writing this response knowing that it’s not going to be a very popular view point, but I think it’s worth mentioning. Looking at the various types of data visualization for this week, I have to admit that some of them don’t quite make sense to me. I understand the point of visualization: to organize the data in a way that is easy to interpret, and easily presentable. So some of the projects, like the Cooper-Hewitt’s color history (while lacking an interpretation and meaning), or the Tatelet (which has no “data” purpose what so ever) fulfill their purpose well, but in a very abstract sense. But these data visualizations do not portray data in a practical way – they are the epitome of the “art hack” or the DH repurposing information.
Even more problematic for me are the visualizations of Helen Wall. These data visualizations have a clear purpose, and interpretation, as well as a very clear portrayal of information. (Theoretically, I shouldn’t have a problem with them at all.) Some of her graphs, however, don’t really need to be graphs at all. The artistbio’s by country graph doesn’t help me understand that information any better, in fact, it makes getting a finite number even harder. This, to me, defeats the purpose of organizing data. At that point, it feels like grasping for cultural capital. Like the image below:
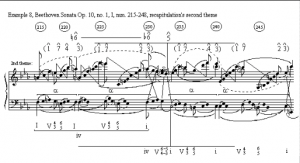
This is also a data visualization, but it portrays very little information if you do not understand the theory behind the graph that compacted a large amount of information into this small little image. It can also be replaced by a short explanation and a table that clearly communicates finite quantities, and ideas.
It’s not the idea of looking at information from a new approach, or reorganizing the data that I have a problem with. It is the bizarre obsession that we have with visualizations – why do graphs hold so much cultural capital? And why do “digital” approaches to information always seems to end in graphing information when it is not more approachable or helpful to do so? Are there other ways to make information more digestible but relay just as much information?
I definitely had the same issues with some of the visualizations that we looked at this week. I feel like there is an evident tendency to make some kind of visualization without consideration for what it will mean to viewers if it will mean anything at all. Visualizations made simply for the sake of producing visualizations when their purpose could be better served by some other medium, could in some ways be considered a waste of time. I agree with you on the fascination with digital approaches and visualizations and I think it can manifest with somewhat meaningless representations of the data, although it may very well be that what we consider meaningless might go on to prove valuable for another.