Class Blog

LA Controller

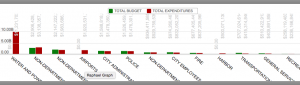
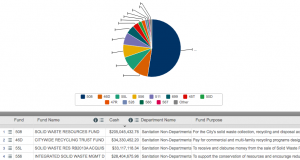
I chose to examine a data set from the L.A. Controller’s Office that focused and describes L.A. Procurement This category is under the label of “Purchasing” and when I followed the external link, I was prompted with a page that was titled, “Data Cards”. This data set is comprised of fifteen categories, each labeled by the name of the expenditure, the quantity of what was purchased, and lastly the final cost. A record set in this particular data set is comprised of a description, cost and date of purchase of a specific type of item. These records, constituted through a detailed description of the procurement detailing the date of purchase, cost, description of the item, and supplier. According to Wallack’s and Srinivasan’s definition of identification of a data set, this digital representation of various categories that are related to the Los Angeles Controller’s Office, of which there are records that detail the specific datasets within each category. However, Wallack and Srinivasan mention that the different representation ontologies may shape reactions to them in varying ways, so that it is very important to consider ontologies, their completeness, in addition to their overall quality for comprehension.

I believe the person that would find this data set more illuminating is someone who wants to know about the expenditures of the city. The ontology provided is completely monetarily based and someone searching for a deeper narrative may want to consider additional information to better understand the community itself and what that community requires as vital resources. This information would also be helpful to someone to is attempting to understand what the city government is allotting money for, and the exact quantities which could be cross referenced with a list of community needs so that someone could visually see what is being asked for and in turn, what is being provided.

Week 3- LA Control Panel

I chose to analyze the data set “Budget vs. Actuals” by the LA Controller’s Office. This dataset allowed me to compare the budgets allocation for each Department’s expenditure accounts to their actual expenditures. The data types for this dataset include the Budget Fiscal Year, the Department Name, the Total Expenditures (in dollars), the Total Budget (in dollars), and the Account Name. In this data set, the budget fiscal year is 2016. The fiscal year for Los Angeles is July 1 2015 to June 30 2016.

These data types create a record that aims to highlight the disparity between a department ’s budget and expenses. It aims to exemplify how money was meant to be spent, and how money was actually spent. Each record includes the budgeted dollar amount per department , and then the actual money spent by each department . It shows us how careful some department s are with money and how careless other department s are with money. Because we all live in LA, this dataset is personal to us as citizens because a lot of this money being spent comes directly from taxpayers.

screen-shot-2016-10-16-at-2-48-21-pm

In “Local- Global: Reconciling Mismatched Ontologies in Development Information Systems,” Wallack and Srinivasan define ontologies as data systems that “essentially share infrastructure for individuals to function as a group”(Wallack and Srinivasan 1). In other words, ontologies serve as a link between different groups and between the group and the individual. Ontologies also “work to create and enact worldviews within the social group and situate knowledge within the organizational or community setting”(Wallack and Srinivasan 1). The dataset which I chose to explore portrays an ontology pertaining to the budget vs. the actual spending of various departments within Los Angeles County. This ontology would be classified as a meta- ontology because it is created by the state, yet the data is very confusing to read and understand by the ordinary citizen. It took me a while to figure out how to use and understand the data because there were a lot of confusing terms for people not involved in finance.

Because of this, this ontology makes the most sense from the point of view of a city official responsible for creating budgets for various departments within Los Angeles. This person would examine this ontology to determine which department should have more or less money in the budget, and adjust budgets for the following years accordingly.

This dataset does a great job at portraying visually the disparity between the budget and actual spending of each department within Los Angeles. It tells me that many departments either have no care about the money they spent, or had extenuating circumstances which forced them to spend a lot of money they didn’t have. For example, the biggest disparity between budget and expenditure is from the Department of Water and Power. They spent $11,231,703,314.55. Their budget was $0. This enormous spending of money is confusing- why did they spend all that? Why was their budget $0 to begin with?

Wallack and Srinivasan argue that, “While any group’s ontology is unlikely to match that of every individual within the group, the extent of mismatch tends to increase with the scale of the group and the differences between the purpose of individual and group ontologies” (Wallack and Srinivasan 2). Specifically, the meta-ontologies created by the states lose a lot of local context and important information pertaining to individuals and district communities. The ontology loses its humanity- it becomes a record that is so broad and vague that individuals lose their voices in it. It only illuminates a small department of the population and leaves out a lot of individual voices. In terms of this specific data set, the most important component of this ontology which gets left out is its relationship to the individual. We have no information about how this spending and over- spending of budgets directly affects the individual. Perhaps because so many department s over spend, the individual tax rate goes up, causing financial stress and burden on many individuals. Furthermore, another huge question that I have after examining the data set is where does the money come from that the department s have over- spent? Because so many department s went way over their allocated budget, where did they get this money from?

From the point of view of a government critic, I would use this dataset to highlight the incredible amount of spending that goes way over the budget prescribed to each department . There has been a tremendous loss of money by many of these departments- money that was not even allocated to them in their budget. I would ask where this money is coming from. If it didn’t come from their budget, where did they get it from? Are they contributing more to the debt that the state is in, or are they using money from other budgets or places that the public is unaware of? I would view this ontology with a critical eye- I would think that many departments in Los Angeles don’t know how to manage and balance their spending and I would assume that the county is in great debt because of it.

Blog 3: City Budget Expenditure

From the L.A. Controller’s Office, I decided to explore the City Budget Expenditure dataset. This dataset demonstrates the how much the city of Los Angeles aims to spend as their budget compared to much how they actually spend under their expenditure. I found this dataset interesting because I’ve always wondered how much money is allocated to each department from the budget and how much is actually spent by the city.

 
The data set is categorized by many records types: Fiscal Year, Department Name, Fund Name, Account Name, Total Expenditure, Budget Transfer In/Out Amount, Total Budget, etc. Under each category, it allows readers to juxtapose how much money is being budgeted under a certain department as opposed to how much money is being expended from the account, and any other additional transactions to make this expenditure possible. We can begin to understand that certain departments required more funding, such as water and power.

 
This dataset is catered towards policy makers and city administrators to oversee the city budget to ensure that the money is being efficiently spent. And if the money is not being efficiently spent, they can continue to utilize this dataset to infer which policies need to be made in order to cater to departments that need more funding. However in order to further understand the dataset, we need to understand Wallack’s and Srinivasan’s article, “Local-Global: Reconciling Mismatched Ontologies in Development Information Systems.” They argue how “technologies that could improve living conditions and economic opportunities [are] rejected because they were inconvenient for community practice” (Wallack and Srinivasan 3). This creates a problem for policymakers because in order to be sustainable, they need to gain a better understanding on community ontologies. However, there isn’t enough information on state ontologies, creating information loss.

 
From this dataset, we can infer that the city officials overspend than budgeted. However what gets left out is how much of that actual money was effectively spent. If only there was a separate column specifying actual cost, we can see how much money is being spent to pay off the cost of each department’s projects and fees. And if we see that the expenditure amount exceeded the total cost, we can infer that the money was being spent on inadequate costs. This excess spending could have been reallocated to a department that needs the money more.

 
This dataset could also be seen from the point of view of citizens and voters, who have the power to either re-elect the current government officials or elect a new one if they are unsatisfied with the current one and their contribution to the LA community. This places many government officials in a tough spot because they want to do what is best for the community but at the same time they want to spend the money efficiently, which may not be beneficial for the entire community, so finding that fine balance is really hard.

L.A. Controller’s Office: Health, Environment and Sanitation

The “Funds relating to Health, Environment and Sanitation” dataset collects information on government money made from various health and environment-related municipal services.  Data types recorded include the Fund Name, Cash amount, Fund Purpose, Sources of Funds, Ending Fund Balance, Assets, Liabilities, Current Collected Revenue, Currently on Budget, and more.  These data points make up a record that is distinctly aimed at recording each fund’s monetary information.

In “Local- Global: Reconciling Mismatched Ontologies in Development Information Systems”, Wallack and Srinivasan discuss how “ontologies represent reality, but this representation of information may in turn become the basis for actions that in turn shape reality…Any actor’s effectiveness in achieving their goal thus depends on the quality and completeness of their ontology” (3).  Therefore, the success of any public policy is partially dependent on the “completeness” of a dataset on which the policy is based.

The “Health, Environment and Sanitation Funds” dataset has an ontology, in which its data is directed primarily at the monetary spending, sources and revenue for municipal services.  For example, this dataset displays the astonishing amount associated with the “Solid Waste Resources Fund” – more than $200 million!  As a result, this ontology makes the most sense to provide information for  any city department in charge of keeping track of profits, expenses, and the movement of funds. This system is an effective way to follow where large amounts of money are being both spent and received.

screen-shot-2016-10-15-at-9-09-58-pmAs Wallack and Srinivasan state, “States’ attempts to promote “development” are thus limited by the information loss between the community ontologies that define development and meta ontologies that guide their actions” (3).  This “information loss” is a result of each dataset’s particular ontology, and how it may not be able to tell any other narrative than the one it was created for.  This can be seen clearly in the ontology of the “Funds relating to Health, Environment and Sanitation”, and how it is directed at tracking government spending.  The ontology of a dataset greatly influences the policies for which the dataset is being based on.

Since the fund highlights the money aspect of health and environmental services, it does leave out other data points.  For example, this dataset does not take into account the success or customer satisfaction of the services.   Projects for “street drainage improvement”, “Air Pollution Reduction Projects”, a “center to provide drug use education”, and more could be evaluated to see if actually made a difference in improving the city.  This could be an example of a useful ontology from someone else’s point of view.  For instance, an environmental organization would shift the emphasis from money to one of city betterment and improving the health of citizens.  They would be interested in questions like, how was the city’s solid waste sorted to be as environmentally-friendly as possible? How much did the “Air Pollution Reduction Projects” actually reduce L.A. air pollution? These are examples of others questions that could be asked, and were not addressed in this dataset ontology.

Blog 3: City Appropriations, Expenditures, and Revenues

I explored the Appropriations, Expenditures, and Revenues data set from the LA’s Controller’s Office. This data set includes the ledger transactions for the city’s appropriations, expenditures, and revenues. I thought this set would be a way to gain insight on where and how the city is spending money.

This data set specifies information such as the fiscal period, department, funding type and name, account name, revenue source, activity name, total expenditures, budget, and more. Each record is a specific transaction and keeps track of when money was spent, by what account/department, for what purpose, and how it alters the budget for the city.

Using Wallack’s and Srinivasan’s article to examine this dataset closely, this dataset’s meta ontology was created by the city as a way to organize and materialize information regarding expenditures that needs to be monitored by administration. This ontology makes the most sense from a policy maker and city official point of view. They would use this data set to see where the resources are being allocated and if new policies need to be enacted as a way allocating funds more effectively.

When states create these meta ontologies, it unfortunately “sheds much of the local context in order to ensure tractable management for policy purposes” (Wallack and Srinivasan 2). These data sets provide an essential form of infrastructure to the administration of the city, but the city cannot fully understand the community they are trying to represent. Ontologies “impede communities ability to impart and communicate information and states ability to fully understand the territories they govern” (1). This is problematic because this meta ontology is aiming to monitor economic activity for the city, but the way it represents information shapes how funds are being allocated to the community.

How the communities are being affected by these expenditures is being left out of the data set. This data set notes what department and activity this money went to but it does not specify how exactly the money was used or how it directly served the community. Community input could make this data set better to show the city how their expenditures and efforts may or may not be effective. Since the data is published digitally, community members and citizens can take this data and manipulate it to represent their own needs. This data could be used more effectively if this ontology was more inclusive to community attributes and if it noted how the expenditures affected community utility and wellbeing.

If I were to start over with this data set from a different person’s point of view, I would note how interesting it is that the city published their expenditure and revenue report online to the public. I would like to see a more community based ontology with descriptions on how each transaction was used to affect the citizens.

Week 3 – City Revenue

I looked at the City Revenue data from the L.A. Controller’s Office. This data set was displayed on a spread sheet which contained the description about what type of department the revenue was coming from and the data relating to revenue. To be more specific, each record constituted of:

Different descriptions:
Fiscal Year the data was collected, The department name, revenue source name, fund name, revenue class name

Different types of codes:
Revenue source code, revenue class code, and the department code

Revenue Data:
Adopted Revenue, Amended Revenue, Revenue Budget, Revenue Collection, % Revenue Collected, Fund.

From my perspective, I don’t think this data set succeeded in focusing on individual people or even individual group, rather their goal seemed to be recording the amount of revenue different types of department was bringing in and a bit of information about what type of business that department is under. Especially after reading Wallack and Srinivasan’s article about ontology, it seems like there’s a huge disconnect between the data gathered by the city vs data that would be helpful for the people within the communities that this data is extracted from. With this type of data, it would be most useful for government officials or anyone in general who are seeking to find out what types of department bring in certain amount of revenue. Seeing that the goal of this data set was to just relay budget vs collected revenue, the data set was able to fulfill that goal. The data set was only provided information about the revenue in relation to a department within the city, which I thought was disappointing. I think the data set could have also included information about the people associated with these department.

Although the data set gets pretty specific on showing the different revenues each department brings in, there’s no information in the data set that relays what businesses these departments are part of and where they are located. I am aware that the data came from businesses within the L.A. county, but L.A. county itself is a huge region. There could be a department of building safety in both Westwood, CA and Pasadena, CA. The location of these department could have a huge impact on how much revenue they bring in. Furthermore, the type of business are associated with also plays a huge role in the amount of revenue they can bring in.

If I was trying to collect data about the city revenue so that anyone could easily access it and get an idea about the revenue each county brings in, I would first exclude all the different types of codes within the current data set since it provides almost no additional information to the layman. I would then include the location and the name of the businesses each department is under. I might also add in what the average amount of income is for that county so people could get a general idea how well the business is doing relative to the county’s economy. It may also be useful to include how many department each county has as well as the county population to see if  each county had enough of the said department.

Week 3 Post: Ontology of Dataset

Wallack and Srinivasan argue in their paper that the divide between states’ and communities representations of ontologies can lead to information loss that silences the voices of individuals within the decisions made by states. An interesting comparison of two datasets from the L.A. Controller’s Office, shown as the top and the bottom result from the list of highest rated datasets, demonstrates how the differences between the most and the least valued datasets convey the presence of mismatched ontologies between the state and individuals.

The most highly rated dataset, “Balance of All City Funds”, provides 42 data types including the balance of the funds, the source of the funds etc. The record in this dataset is a specific city fund. The dataset on the opposite end of the spectrum, “Neighborhood Council Expenditures for Fiscal Year 2014”, provides only 8 data types like the name of the neighborhood council and the amount of the expenditure. The record in this dataset is a specific expenditure related to a neighborhood council.

Although both datasets can be defined as meta ontologies from Wallack and Srinivasan’s argument, as both are produced by the state of Los Angeles, the first dataset leans towards an inclusive meta ontology while the second dataset embodies a state meta ontology that “sheds much of the local context in order to ensure tractable management” (Wallack, Srinivasan, 2). “Balance of All City Funds” provides detailed information on the sources and purposes of the funds and how they are used eligibly. For example, row 17 and 18 record two funds with the purposes of “Zoo improvement projects” and “Animal shelter facilities” respectively. One can easily combine the two specific categories into one such as “Animal protection”, which is exactly what have been done in the second dataset. The task of each expenditure in “Neighborhood Council Expenditures for Fiscal Year 2014” is labeled with general attributes such as “Office” or “Event”.

The difference in intricacy of the two datasets may account for the difference in their ratings by individuals. Ones who interact with the second dataset can feel isolated from the actions of the state without knowing what exactly are happening behind the curtain, while those who browse through the first dataset can draw a detailed picture of the state’s decision-making. Although the first dataset does have data types like “Grant Receivable Asset”, everyone with or without a speciality in accounting or finance can grasp at least a piece of information from the dataset to understand the budgeting of the city, albeit to varying degrees. The second dataset, however, excludes anyone without the knowledge regarding the specific usage of each expenditure since it does not expose any detail.

I cannot think of any improvements over the ontology of the first dataset, but I see the ontology of the first dataset as a framework to which that of the second dataset should assimilate. From the perspective of an individual who would like know the details regarding an expenditure, if a contact information of the person in charge of the expenditure or the documents related to the expenditure are provided as in the first dataset, he or she can can gain access to the details even if not many numbers or descriptions are record directly in the dataset.

Funds Relating to Health, Environment, and Sanitation

From the L.A. Controller’s Office, I chose to explore the dataset regarding funds relating to Health, Environment and Sanitation. I choose this set because I thought it would be interesting to find out how much our city really spends on the environment.

The data types of this set include the categories of Fund name, cash, department name, fund purpose, sources of funds, eligible uses, and many other categories regarding the specific logistics regarding cost and efficiency. The records are all based on general categories that have been funded for the purpose of making the city more environmentally friendly or sustainable.

From reading Wallack’s and Srinivasan’s article titled “Local-GLobal: Reconciling Mismatched Ontologies in Development Information Systems”, we see that there is often a major discrepancy between communities and ontologies. By applying the knowledge I gained from that article, I can see that even this dataset  represents this lack in connection. The data has a category for fund purpose, however, we never see how these purposes went into effect. For example, under the department name of transportation, there is a category named Mobile Source Air Pollution Reduction with a spending report of  $4,923,189.09. This category states that there is a fund purpose “For Air Pollution Reduction Projects”. There are many issues with this data regarding how its being perceived. First being that the purpose is incredibly broad. I have no idea what specific projects are being aided, how many projects exist and if these projects are even effective. Wallace and Srinivasan mentioned that Ontologies represent reality, however it is the representation of these ontologies that actually shape reality. In this case the reality is almost nonexistent as I have yet to learn much from this dataset other than a few simple menial facts.

I think the officials who create budgets for LA County would find this the most useful as they could use this information as a reference in creating more budget proposals. I also think that environmental activists who believe that the city is not doing a good job at reducing air pollution would find this information useful as it shows the contrasts of budget vs. efficiency.

This data set shows that the city spends an incredible amount of money regarding waste funds compared to recycling and renewable energy funds. Also, the effects of these funds are left out and no data regarding the total conservation reductions are shown.

From someone else’s point of view, I would see that this data set shows how much the City of Los Angeles has improved its funding on environmental and sanitation services. I would say that the city of LA has taken great steps into funding recycling activities and preservations services.

Los Angeles’ 2013 City Payroll by Job Class


I observed the Payroll by Job Class data set, which is based on the city payroll data for all Los Angeles City Departments since 2013. It is organizes into a very detailed spread sheet with a lot of useful information and is updated on a quarterly basis (when in its current year) to ensure accurate and up-to-date information.

The spreadsheet has dozens of data types. In the order from which they are read left to right, the data types are: year, department title, payroll department, record number, job class titles, employment type, hourly or event rate, projected annual salary, Q1-Q4 payments, payments over base pay, percentage over base pay, total payments, base pay, permanent bonus pay, longevity bonus pay, temporary bonus pay, lump sum pay, overtime pay, other payroll and adjustments, MOU titles, department class, pay grade, average health cost, average dental cost, average basic life insurance, average benefit cost, benefits plan, and finally, a job class link. A record in this database is whenever a row is added, in which each of these data types, or columns, are filled out for every individual and their position added.

Using Wallack’s and Srinivasan’s definition of ontology, I would classify this dataset as a meta ontologies. It is created by the state in an attempt to inform its citizens about pay roll in certain cities, yet the data might overwhelm or allude citizens who do not understand how to read data or have technological barriers to access it. Because of this, I believe that government officials, whether it is the mayor or a local city police officer, will find this information most useful and illuminating. This is not to say, however that a local citizen might wonder where their tax dollars are going to or how much the pay is for a certain position. Yet, I believe it is most useful to government attempting to figure out the fiscal year.

The phenomenon in this data sets describes the way pay increases as you move higher in the city ranks, as well as responsibility. It attempts to show how often and how much officials get paid in the position they are in, as well as how they spend that money when using government resources. However, even though this dataset is very detailed, I find it missing some things. It does not have the names of government officials, which might confuse people when they see the same titles. It also does not mention how long the person have been working for the government, which might result in confusion for differing salaries within the same position.

If I was starting over with this data collection and was someone else with a different point of view (and didn’t know it was made by the city), I would think this was a critique of how much government officials are being paid using tax payer money.

Virgina Espino and Renee Tajima-Pena Collection of Sterilization Records

The finding aid for the Virgina Espino and Renee Tajima-Pena Collection of Sterilization Records articulates the events surrounding Madrigal v. Quilligan, a 1970s federal class action lawsuit brought to court by ten Latina women suing E.J. Quilligan, M.D. and his colleagues for the coerced sterilization of Latina women at the LA County University of Southern California Medical Center. The case was lost, but in the momentum of the civil rights movements, it increased public awareness and activism against the forced sterilization to minority women.

The project is divided into two main record types: court documents from 1975-1979, and oral history recordings from 1994-2001 in the form of 10 cassette tape interviews of those involved in the Latina rights movement, those who supported their case, and a resident at the hospital where and when the women were admitted and coerced into sterilization. The court documents are each described with a Box number, Folder number, date, title and content note, the associated content of these descriptors likely only able to parse together the skeleton of what it meant to be the plaintiffs in this court case. That is, while these documents do work to fill out much of the court case narrative and how it may have given voice to many of the issues at the center of the Latina women’s movement, it cannot capture the psychological effects that the case or the events it addresses had on its subjects then and over time. That the judge ruled against the Latina women would alone suggest that content in the court case records is going to be filtered through a biased, racist lens.

The interviews had in the tape cassettes, and in documentaries like No Más Bebés, which, according to the finding aid, sourced many of the records in this collection can help begin to fill in the missing perspectives and counteract the skewed narratives in this story.