DH101

Introduction to Digital Humanities

Page 38 of 38

Week 1 Blog Post–Mapping The Republic of Letters

Introduction: Mapping the Republic of Letters is a digital humanities project spearheaded by Stanford University that chronicles various interactions between historical century intellectuals and their peers. Through various case-studies of these influential thinkers, the project constructs a fascinating, but incomplete, social network of correspondences.


Source: The sources are highly variable for each subject. Some are in non-English languages (D’Alembert), pull from existing databases (Voltaire and Oxford University), or lack a large number of correspondences (Galileo). Furthermore each case-study has different project leads, start dates, and teams.


galileo-galilei

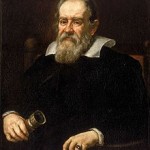
Galileo’s Case-Study: Galileo’s case study is challenging because many of his letters were destroyed purposefully during his trial, or carelessly by his heirs. Either way, the project claims the source material is limited. The material available is from Antonio Favaro’s Edizione Nazionale delle Opere di Galileo Galilei. 


Voltaire, détail du visage (château de Ferney)

Voltaire’s Case-Study: Oxford University’s Electronic Enlightenment Project provided the correspondence metadata. This information was collected in portions that Oxford called “Tranches” that sourced from the New York Public Library, Morgan Library and Museum, Besterman’s Select Letters of Voltaire: Translated into English, and more.


Process:

Again, because of the various case-studies and team leaders, there aren’t unified processes. The Republic of Letters is an aggregation of various smaller projects under the same theme. As Stanford creates new research partnerships, new digital correspondence studies are added. Many of these projects are not even hosted directly on the site. For example, John Locke’s information is hosted on the researcher’s GitHub page.


Galileo’s Case-Study:The letters are organized and segmented by year, recipient, and destination city. These different categories were then statistically processed to create charts and graphs. The database was built from written publications, they had to be entered to be digitally organized.


Voltaire’s Case-Study:  The original documents were already compiled by entities like the New York Public Library or authors like Besterman. The leaders of the Electronic Enlightenment Project had to organize them in a digital database for other scholars to easily access.

While the Stanford team did not disclose how they proceeded with the various forms of data visualization, there are many aspects at play for this case-study. The data had to be quantified and statistically analyzed to make visual representations like bar-graphs and pie-charts, segmented for geographic maps of the correspondences, and organized into various categories for the colored keys.


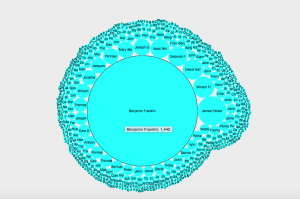
Presentation:There are many visual aspects, like a mapped network of the correspondences between intellectuals and their recipients, or graphs and pie charts showing statistical data regarding information like the number and frequency of letters. Because of differences in the available metadata, not all case-studies are visualized in the same manner.

For the website as a whole, there is definitely a need for UI improvements. It’s never really clear where you should be going–links to visualization are not always clear, some image elements are missing, and the homepage does not effectively explain how to use the website.


Galileo’s Case-Study: The project performed numerous types of metadata analysis to visualize the number of letters Galileo sent per year, Galileo’s recipients, and a calendar of letters categorized by the destination city. The data is not interactive or searchable, because the project only presents the final results as images of graphs and charts with color-coded keys.


Voltaire’s Case-Study: The presentation aspect of this case-study is much more complicated, and is hosted on DesignHumanities.org. By choosing a date range for the letters, three data visualization options are available.

  • The first is a map of the geographical locations of his correspondence destinations, made interactive by circles. By clicking these, you get access to a table of information like recipient, date, and a URL to the transcript hosted on the Oxford EE Project.
  • The second portion is a stacked bar chart with colored segments. These colors are categorized by “milieu” of the recipient, like “Letters and Sciences,” “State Officials,” “Elite Society,” “Military,” etc. It can also be categorized by gender or nationality.
  • The third portion has a visualization of the different combinations of gender, nationality, and milieu.

Reverse Engineering DH Project

In a world where technology rapidly cultivates human civilization, it is not unexpected that literature in the forms of books, manuscripts, journals, etc. would go untouched. Numerous amounts of information that embody these mediums of literature get lost and along with them, the knowledge and discoveries from our ancestors. To prevent this, Digital Humanists, with the help of modern day technology, have started projects that tackle the challenge of retaining the information and presenting it in a new light. One such project includes “London Lives”. London Lives is a website that holds an immeasurable amount of information regarding eighteenth-century London in a digitized form. The technological nature of the project allows for a new interpretation of eighteenth-century London because of the ability to reach a broad audience from all over the world.

Screen Shot 2015-10-03 at 10.36.05 AM

The creation of London Lives was made possible with the help of the Economic and Social Research Council (ESRC) and with the funds of the Universities of Hertfordshire and  Sheffield . With these funds, a variety of sources relating to eighteenth-century London were collected to formulate the encyclopedic nature of the site. These sources include over 240,000 manuscripts and printed pages from eight London archives. In addition to these tangible sources, there are also fifteen datasets created by other projects. All these sources combined gave birth to London Lives.

With the data that the humanists collected, they have compiled a list of over 3.2 million names. One of the main functions of the site is that these names were made searchable. The site compiles a biography for the names that stand out most, along with supporting or related documents/images that they have digitized from the sources collected. Not only does the site compile biographies for the names, the site also creates categories of topics that relate to multiple documents/images from different sources. Complementing this function is the “automated matching” service that allows users to select a name on a single document type and compare it to another document type from different archives. All these functions allow the users to explore the world of eighteenth-century London in a different dimension than those who did not have digital technology back then. Being able to easily connect people to other people/events has brought about a new interpretation of the lives/culture of London and its past. The simplicity of the site functions and the compilation of the recourses into one website provide a great resource for scholars, students, and people in general.

With the users in mind, the creator had taken into account the design of the User Interface. The home page contains a search box where keyword is the default function to highlight the broad range of searchable text. This I would infer would be for the general users who are curious about what is available on the site. Once the curious users are done playing with the search function and see what the site has to offer, they are given the option to dive deeper into the content of the site through the option to browse documents (located below the “Search” tab) under specific categories. By providing these categories, the site, in a way, is educating the curious users of what these documents contain and what they generally mean in order for the users to generate their own ideas of what they think the documents say about eighteenth-century London. After having explored the site in greater depth, the users are then given the option to become “Research users” (located below the “Browsing Documents” tab). These users are those who become more invested in the site and are given more advanced functions to explore the site.  The designer of the website cleverly navigates users through the site in ways that can allow the most general user become a “Research User” . This project’s presentation would generate more audience than an enormous stack of textbooks ever could.

Week 1 blog post: DH project analysis

When examining one of the projects posted on Brain Pickings, “Mapping the Republic of Letters” (http://republicofletters.stanford.edu/index.html ), the visualization of a social network of an influential people became more clear. This philosophical and historical project uses the database of the Republic of Letters and creates a visualization of the social network. Its structure resembles the Kindred Britain project, because both are social network analysis, however the layout varies.       The Stanford University Humanities center created this project; through the interpretation and visualization of individual case studies, the overall network is not revealed. But rather, a clearer image of different parts of the whole Republic of Letters intellectual community is revealed. The sources used to create the project are not clearly stated. The Brain Pickings article mentions that data is pulled from the Electronic Enlightenment database. It is important to note that the project does not display or contain the actual letters, but only the connections between the intellectuals that the letters reveal. Clusters of social networks are revealed through the letters.

Screen Shot 2015-10-04 at 3.15.33 PM

The processes of the project take individual case studies and give a brief description of that intellectual’s correspondence. When clicking on a visualization button, the network of letters of that person appears. Various other charts are shown to represent the timeframe and location of origin of the letters. The visualizations help a viewer imagine the social network of the individuals in a clearer manner. Each case study has different visualizations to represent the location and time of the letters and correspondence. Nothing content related is mentioned.

The Humanities and Design Research Lab at Stanford created the project. Their presentation is somewhat confusing. Not all the connections can be seen at once; each is organized within a case study and can only be viewed when looking at one case study. A detailed narrative panorama is the home page. A video introduction gives some background information, while the contributors are not mentioned directly on the page. Linked through a “related” section, the lab’s website can be accessed to find more information about the contributors.

Overall, the projects website was relatively difficult to navigate and inconsistent within what information was available. The visualizations were not clear and since they were different for each individual, the comparison was difficult to make. The fact that the researchers were not immediately credited and that there was no about page or tab made the information of the social analysis much more difficult to understand as a student looking for information.


Week 1 Blog Post

Screen Shot 2015-10-04 at 3.42.04 PMhttp://salem.lib.virginia.edu/home.html

            The project I explored was the Salem Witch Trials Documentary Archive and Transcription Project. Created by Benjamin Ray at the University of Virginia, this online archive contains court records, record books, and other documents that chronicle the cases and occurrences during the Salem Witch Trials. The site also has maps of the Salem Village. The website provides text analysis of the records as well as data visualization, primarily in the form of the maps. The primary purpose of this site is to aggregate large amounts of information on the Salem Witch Trials and make them readily accessible.

The documents are from a variety of museums, libraries and archives. Some notable sources include the Boston Public Library Department of Rare Books and Manuscripts as well as the Judicial Archives in Boston. The website utilizes a total of seven sources to collect all of the relevant information. Since there are a myriad of sources, this website is able to provide a very comprehensive catalog of the events of the Salem Witch Trial.

The creators digitized the documents and uploaded them on the website. They scanned images of each page of books and documents and provided links to them on the site. Some of the pages of the book appear only as images, while others have a more interactive aspect allowing the user to navigate the pages like a book. In my opinion, the most useful element of the website is the transcription of case files. The creators of the digital project transcribed case files of individuals involved in the Salem Witch Trials and included links to the original manuscripts. The site also contains biographies of notable individuals of the time period.

Finally, the presentation of the information encourages the user to look through all of the documents and resources. The website distinguishes the information by its type, books and letters, documents, maps, and people. This categorization allows for easy navigation and successful research. The website also contains maps of the Salem Village and allows the user to zoom in and locate the houses of many residents. The zoom navigation is not very sophisticated; however, it does provide an aspect of interaction with the map. Also, users are able to user can compare the court record transcription to the original manuscripts and note any differences or similarities.

Overall, the presentation of the information is very simple and not extremely advanced. However, it is successful in aggregating large amounts data and providing users with a platform to learn about the Salem Witch Trials. I would improve the user interface so that the website would cater to a larger audience. Currently, I think the users are mostly scholars who have the patience and interest in looking through the website, even if it is not very visually pleasing. To improve this project, the creators can alter the interface so that commonplace individuals who have a little curiosity about the Salem Witch Trials would feel inclined to explore the website.

Reverse Engineering Quijote Interactivo

Quijote Interactivo is a digital humanities project created by the National Library of Spain that focuses on the novel Don Quixote. The project has aspects of a digital edition, a multimedia narrative, and a text analysis.

Screen Shot 2015-10-04 at 1.55.33 PM

Source: The information in the project comes directly from the original spanish edition of Don Quixote, written in 1605 and 1615 by Miguel de Cervantes. The project also includes descriptions and links to other texts that may have influenced plot elements and literary conventions from the time the novel was written, and another page uses historical texts as sources to detail daily life from the time period.  A timeline of the editions of the novel also cites sources of relevant historical events and other textual works.

Process: The main focus of the project, the digitization of the text, involved making digital copies of the each of the pages in the original edition, high-quality images that would allow viewers to zoom in. The pages were also transcribed with the text in a more readable font.

Screen Shot 2015-10-04 at 1.55.47 PM

The authors of the project sorted through the locations mentioned in the text and matched them up on a map, and put all of the historical sources with the corresponding moments in the novel.

Present: The project is presented in an interactive way that is clear and easy to navigate, even though it is all in spanish. You can search the text, go to a menu of the folios, or choose a specific page to view. You can flip through the text of the novel itself just like you would with a real book.

Screen Shot 2015-10-04 at 1.55.59 PM

Next to the text, you can click on options that are uniquely modern: printing the page, zooming in, or sharing on social media or email, as well as switching to viewing the transcription rather than the image of the original edition.

The rest of the information on website is divided into a map of adventures, a timeline of editions, source texts, and a guide to everyday life in the 17th century. All of the information on the map and timeline is interactive, with zooming options and descriptions that pop up over the rest of the text. The historical sources are divided into categories and are easy to sort through. Clicking out of all of these pages brings you back to the most important part of the project: the text.

Finally, the project also includes a gallery of artwork that can be sorted into drawings, etchings, and ephemera, as well as list of music and a video that can be played directly on the website.

YesterdayTodayTomorrow: Biblion at NYPL

Home page of Biblion: WORLD'S FAIR

Home page of Biblion: WORLD’S FAIR

New York Public Library’s Biblion: World’s Fair: Enter the World of Tomorrow presents an exhibition/visualization of material from a huge archive deposited with NYPL in 1941, after the close of the 1939 World’s Fair, consisting of documents, drawings, letters, newspaper clippings, photographs, and other ephemera associated with the development of the World’s Fair project in the 1930s. The site is also available as an iPad app.

The home page presents six sections (in this order): A Moment in Time: On the Brink of War; Beacon of Idealism: Building Democracity; Enter the World of Tomorrow: To Futurama … and Beyond; Fashion, Food, and Famous Places: Pop Culture at the Fair; From the Stacks: The Fair Comes to NYPL; and You Ain’t Seen Nothin’ Yet: Fun at the Fair. Each of the sections presents a short introduction, featured stories, image galleries, and a set of essays. The galleries include images with links to archival information, related material, and to a page with information on how to purchase the image for your own use; the featured stories offer a little more contextual information on the material (mostly photographs, although there is some audio); and the essays are the most analytical, although still strongly tied to imagery.

The project represents a major public library’s digitization and electronic presentation of an early twentieth century archive that was created with the future in mind; not only was the World’s Fair designed to present the “world of tomorrow” (ironically, in an age that was well aware it was facing a potentially catastrophic world war) but the Fair Corporation had worked nearly from the start with the intention of preserving its papers at NYPL. The assets are almost entirely paper-based texts or images that have been organized according to best archival practices since their acquisition in 1941.

The project is constructed in several layers, moving from easily accessible, popular material (pictures, general information) to, with increasing numbers of clicks, deeper explanatory/analytical work. Given that the archive itself consists of some 2500 boxes of material, someone (uncredited) obviously spent a lot of time sorting through it all to come up with the 15 or so images that appear in each gallery; essays range from an interview with well-known popular culture theorist Henry Jenkins  to a second-hand reminscence of attending the fair to an analysis of the Fair’s menus by a restaurant critic . Given the enormous size of the archive, it’s clear that a great deal of the work involved in the construction of the project went into winnowing it down to a relatively broad, but still bounded, set of representative topics that would be of interest to a general audience but still provide scope for scholarly analysis.

Shagging and Shimshamming: An Abundance of Dance presents static shots of dancers but no video or even audio of the music and dance presented at the Fair.

Shagging and Shimshamming: An Abundance of Dance presents static shots of dancers but no video or even audio of the music and dance presented at the Fair.

The presentation is a largely static collection of text and images–it seems a pity that there is no film or audio, for instance, in the gallery on song and dance at the Fair. However, since the project is based, it seems, solely on the material in the archive, it is also limited by what it was decided to include in the archive in 1941, when film and recordings were not usually considered archiveable in quite the same way as text and photographs. Still, it seems a little odd that the story of a 22-minute home movie of the Fair, donated by its maker, only links out to the videos on YouTube rather than hosting them on NYPL’s site, as do the few other videos in the project. How permanent will those links prove in the long run?

One of the most interesting aspects of this presentation is the extent to which its process is part of the project itself. This is reflected in the the fact that From the Stacks, the section on the archive as a thing, does not appear at the end, where such matters are usually relegated, but smack in the middle of the implicit hierarchy of topics. As the essay by Thomas G. Lannon notes, “Beyond painting a picture of the totality of the venture, [the records] capture the inner workings of the World’s Fair Corporation as if frozen in time, thus presenting to contemporary researchers a model of the record keeping system in a typical 20th century office place.” Since a major focus of the Fair was the prewar world’s imagination of the future, the project offers not only a look at the envisioning of Today by Yesterday, as time continues to go on, the project itself will soon offer a snapshot of Today’s cutting edge for the perusal of Tomorrow.

Reverse engineering London Lives

The digital humanities project I chose to analyze is London Lives, which is a historical website that digitizes and organizes records and information about the events and lives of Londoners during the 18th century.

http://www.londonlives.org/index.jsp

Screen Shot 2015-10-02 at 8.28.26 PM

Sources:

The sources of the site are primarily manuscripts from archives and datasets that the project staff was given access to because of their grant from the Economic and Social Research Council. The manuscripts chosen were all focused on the lives of the common people rather than the royalty in order to assess how regular people influenced social practices of the time.

Processes:

All manuscripts were digitally scanned and transcribed so they could be easily and conveniently  referenced as a primary source. Additionally, the project staff evaluated the manuscripts and created comprehensive biographies on several dozen Londoners, with several dozen more in progress. Therefore, they processed the sources both into directly digitized forms of the information and compiled some of them into comprehensive stories of the lives which the manuscripts refer to.

Presentations:

Overall, this project is designed in a way to emphasize interactivity and allows the user to explore many different aspects of the data. There is a search tool for users to easily find any specific document or information they may be looking for. There is the main browse section where all the manuscripts can be found, which are organized by place they were recorded and by date. As mentioned in the processes section, there is also a major component of the site which focuses on biographies of individuals, which has a tool that allows you to click on keywords that the manuscripts referenced and see examples of those occurrences. Within all of these various sections of the site, names and events and tagged and linked so that the user may easily click through to fin more information on whatever aspect they find interesting.

I enjoyed the way this project had several different ways of accessing information so that viewers of different levels of expertise all could find something they were interested in. We can access both the primary sources of the documents and the biographies that the project staff had put together based on their evaluation of the sources. My favorite part was the integration of the keyword search, where all the lives that involved something like murder or theft, could be accessed and read about from the click of a button. Although the layout of the site could have been more smoothly integrated so that it didn’t require so much clicking to different pages, especially in the browse documents section, I think this project was overall very impressive and well done.

London Lives

London Lives offers the viewer a massive collection of data relating to crime, poverty and social policy in one of the world’s most fantastic cities, London, between the years of 1690 through 1800. The sources this site used contain over 240,000 fully digitalized manuscripts and painted pages from 8 London archives and is supported with 15 datasets. This webpage is extremely interactive and encyclopedic as it allows the user to search for, in digitized form, the lives on commoners living in London and how their lives ultimately contributed to the development of the great city. They also include functions such as Automated Matching which allows users to combine all the names tagged in one group of documents. However, specifically this project is designed to “assess the role of plebeians in the evolution of social practices.”

Here you can see a document:

Sermon-MS-Page-one-JPG

This document was a sermon produced by most likely a member of the clergy. Most of the documents found on this site will look like this and are presented in a chronological fashion utilizing timeline features. These images were digitized by starting out with microfilms of the original manuscripts and then the pages were scanned to create high-definition, 400dpi JPEG files. The manuscript texts were manually typed by the process known as double rekeying whereby the text is transcribed twice, by two different typists, and then the two transcriptions are compared by computer. The manuscripts and other sources were collected from different libraries and educational institutions. Items to be researched are presented in a list on the home page which one can then choose to delve into further study. A wealth of information exists on this site ranging from the historical background of churches, hospitals, courts, and guilds. All of these items have their own links.

Overall, I found this project to be very interesting and user friendly. I was immediately able to navigate the site and find the documents that I wanted to read. This site looks like it took a lot of time and money to make and I think the final result is fantastic. Anyone can search this site at http://www.londonlives.org

London Lives: A Study

London Lives

London Lives is an interactive record of the crime, poverty and social policies in London during the years 1690 and 1800. It includes a fully digitized set of manuscripts and printed pages, both in script and photos, regarding specific aspects of the London society, as well as information for many of the important individuals named in the documents. In digitizing this collection, this DH project brings history to the fingertips of the public. The About Page states that the purpose of researching how individual Londoners engaged with the institutions of their society is to “assess the role of plebeians in the evolution of social practices in the modern metropolis.”

The sources consist of 240,000 manuscripts and printed pages from eight different archives in London. It also includes the datasets from fifteen other projects about London and its individuals. The data collected was chosen with the research initiative in mind. Digitization was a parameter in choosing their data as well, considering the team knew from the start this would be a digital project. An example of the data, taken from the site, is below:

Middlesex Sessions of the Peace, Sessions Papers, 1760, London Metropolitan Archives

While this project is the type typically undertaken by those in academia, the digitization of the data allows the public, especially those not in academia, to link together the records on Londoners at the time, thus allowing anyone to understand the implications of how these individuals shaped the institutions of their society. The project team needed to organize the documents by the document type (where it came from) and then the date within each specific type of document. While this organization falls into process, it can also be characterized as presentation because the team chose to represent their data in this way on their website as well. The project team also did outside research and analysis to provide context about the documents. The project team also tagged the documents for use with keywords to link documents and individuals for use in the search bar later

After the compilation of data and reorganization of data, the project team formatted the website as an interactive encyclopedia. They presented photos of the document itself (primary source) and the information from the page next to it, with linked names to jump from link to link. The project prides itself on the application of a search bar, which finds all related information. The sources are provided at the bottom of the webpages so curious users can continue their quest for information.

(The project can be found at www.londonlives.org.)

Virtual Paul’s Cross Project: An Overview

Screen Shot 2015-10-03 at 10.05.07 PM

Recently, I had the pleasure of taking a look at the Virtual Paul’s Cross Project, a project that enables users to experience the delivery of John Donne’s sermon for Gunpowder Day as it may have been in early 1600’s London. Not only did this project attempt to recreate this speech through an audio medium, but it also provided the exact information of where the sermon took place through digital layouts, what the setting looked like with a visual model, the acoustics of the building structure, the occasion, a typed script of the speech, and who the speaker was. This project definitely delivered itself as a well-packaged database full of material for a user to interact with; however, there are some downfalls that I had noticed that, although minor, still highlights just how complex and difficult it is to compile and execute a digital humanities project such as this one.

Category. I would identify this project as a history-based one. Already from the title of the project, the website’s introduction page contains the event’s date, signifying that this particular date is notable in human history (or, more particularly, British history). On the Purpose page, the creators of this project state that Virtual Paul’s Cross Project, “helps us to explore public preaching in early modern London, enabling us to experience a Paul’s Cross sermon as a performance, as an event unfolding in real time in the context of an interactive and collaborative occasion.”

THE BLACK BOX: Sources, Processes and Presented

Sources. Poking around the whole site, we can see three distinct layers that truly make up this project. In terms of sources, the most distinct source that was supplied was the manuscript of the sermon– a high resolution image of it, actually. Clicking the Sermon page takes you to a page with the image of the script. If you go on the The Script page,  a full translation of the manuscript is given along with the times certain parts of it were given. Clicking on the other pages on the main bar also provided sources such as a model of the overhead view of the setting where the sermon took place, audio recordings of an actor preaching the sermon, and other digital renderings of the building, weather, and crowd size.  To add onto the sources coming from this project, the creators have the Works Cited and Links pages which lists every primary and secondary source they had gotten information from, listed under Support.

Sermon-MS-Page-one-JPG

The image of the sermon manuscript as seen on the Sermon page.

Processes. Categorizing the processes in this project were pretty straightforward– I think Virtual Paul’s Cross Project did a great job in contributing a wide variety of services for users to access on each page. There were enhanced images for the script, 3D visualizations (which possibly employed the use of SketchUp) with zoom and turn features for the setting, audio recordings for the sermon, and digitally rendered flat layout designs for the acoustics and structural aspects of the building this all took place in.

overhead-black-roof-for-WWW-1024x767

The overview model of Paul’s Churchyard, found on the Churchyard page.

Presented. This project surely succeeded in trying to give as much information as possible to allow a great virtual experience. All the sources and processes were displayed on this website through the employment of 3D modeling and mapping, which complemented the audio recreation of the sermon which users may listen to as they browse the encyclopedia-esque site. Every page allowed viewable access and was simple enough to maneuver around, yet encompassed a great deal of material.

Setbacks. I did dislike how it seemed nearly impossible to find out what this event meant in context to world history; maybe it’s because I’m an American, but I don’t know what the Paul’s Cross Sermon(s) were, and what they really did to begin, change, or improve public preaching.

All in all, I can see that even with some minor faults this digital humanities project is extensive and extremely valuable to many users, and the completed product is certainly deserving of recognition not only in fields of history, but possibly in other humanities studies.


Newer posts »

© 2026 DH101

Theme by Anders NorenUp ↑