DH101

Introduction to Digital Humanities

Month: November 2015 (page 5 of 17)

Vectors: Shi Jian

Mark Hansen, the author of Shi Jian (meaning ‘time’ in Chinese), contradicts the mainstream-Western view of time, the passing of one discrete state to another. Instead, he highlights the Chinese thinking of time as a ‘process in between discrete states and perceptions’.

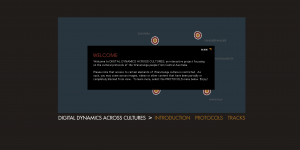
The website interface parallels Hansen’s perspective on time. The website has no navigation bar, rather it only allows the user to go back and forth. The background color is a deep purple with the words “Shi Jian” on the bottom-right quadrant, what I think to signify wisdom and creativity because Hansen’s argument is very abstract which takes time and energy to develop and understand. The color purple reflects the deep thinking put into his argument.

The pages is separated by 2 columns, words on the left, visuals on the right.  Hansen introduces the viewing of time through early western philosophers. Then in the next page, he presents the eastern thinking along with 2 gifs of 5 asian men walking down a path in the winter and summer. The similarities and differences of the visuals helps to highlight his point of time as a transition.

Hansen showcases his 6-month travel in China with over 1200 pictures and 103 videos through the only link in his website ‘Go to Timeline’. There his collection is can be seen in 5 different ways: Span, Place, LIght, P.O.V, and Types of Time. The user can then click on the words and see his photos in multiple ways, through a timeline, color coded, and more. The multiple categories support Hansen’s point that time can be thought of in another way.

Overall, I thought the project was successful because Hansen was able to present time in multiple visuals that the user can go through. However, the timeline was confusing to navigate and a clearer explanation would have helped clarify what the user is looking at.


Virtual Vaudeville: Vectors Project

I chose to look at the Virtual Vaudeville project listed in the “Evidence” issue of Vectors. This one stood out to me mainly because it felt like the most immersive project of the few I looked through when making my choice (and the topic was pretty interesting in and of itself).

Virtual Vaudeville acts as a time machine of sorts, allowing the viewer a look into the nineteenth century and its theater without leaving the comfort of their own home. It is an all-encompassing 3D recreation of historical theater, providing multiple points of view on the physical theater and the acts themselves. Users can watch a vaudeville performance, by comedian Frank Bush, as well as explore the audience reactions and the architectural space of the theater. Virtual Vaudeville considers itself an “interactive, multi-perspectival platform” to mediate between the perception of history and the social and political issues prevalent in the time period the project details.

I read the descriptions first before watching the virtual show, so when it came time to watch, I knew what I wanted to look for so I could evaluate whether the project was successful in its mission. Unfortunately, I had some pretty big issues getting the plug-ins to work on my computer. However, once I solved those problems by downloading the necessary plug-ins, I was able to watch the show with ease. The project is separated into two categories, the performance recreation and the theater fly through, which allowed users to explore and focus on whatever aspect they chose. I actually liked that the two were separated into separate visual platforms because I felt like they provided two very different experiences, one of theater and one of architecture. I’m sure the project designers did this to ensure that users could get the full experience of each. I also thought it was very easy to navigate the site because everything was explicit.

I believe the Virtual Vaudeville project was pretty successful in achieving what it set out to do. I felt very immersed in the show, like I was a spectator sitting in the audience, but I also was able to understand it within the context of the theater, the time and the fact that this is simply a recreation. It’s amazing that these new technologies can provide us with experiences that can mirror times long past. I got to experience an old-fashioned vaudeville show in an old-fashioned theater, which is something I never could have done without the technologies used here.

Vector Project Blog

Screen Shot 2015-11-18 at 7.15.38 PMThe project I chose to write about for my blog is The Virtual World Interactive. The main reason why I chose this project was because I had so much fun playing with it.

This project serves as a tool to enhance the understanding of a book called The Virtual Window: From Alberti to Microsoft by Anne Friedberg. Friedberg wanted to show the forces that  revolve around the evolution of vision. To Friedberg, how “the world is framed” is just as important to “what’s contained within that frame”.

The Virtual Window Interactive was designed to enhance the understanding of Friedbergs’ idea. Navigating through the project was very entertaining. As the editorial have mentioned, the designer likes to have a playful element to the project by making it have a surprise aspect. I was pleasantly surprised when I first experienced the project. I did not know what I was supposed to do and when I realized that my first task as a user was to draw a window, I continued to play with it and started reseting the project to see what type of window I can make that best fits my imagination. Then I started exploring the project more and realize there are a lot of functions to decorate the window frame and choose the scenes that were to be displayed behind the windows that the user created. There were a lot of elements to this project that leads to a sense of control over the world that you framed. At least thats what I felt exploring this project.

I thought it was really cool how the window frames that the user choose has information on its design and in what century it was most popular. Doing so allows me to look outside the window and have a sense of what it feels like to live in that century. Allowing users to choose a scene furthers this experience.

The overall design of the project did a great job positioning the users in a way that forces them to see the world in another life. Everything but the windows was black, including the silhouette of the person in the house/building. Doing that puts the users inside the house seeing only the light that comes from outside. This dark background makes it easy to transport the users to another world because it is most like that a person have experience being in a dark room looking outside there window. Being in a dark room is relatable in any century, therefore it makes it easier for users to see themselves in a house looking out at in a world other than their own.

This project I thought was successful because it served its purpose. The purpose of letting the user experience how vision change throughout time. Through the different types of window I created, I saw a new world from different century. I experienced everything that the editorial said a user should experience when exploring this site which is why I think this project is a complete success.


Week 8 Revilna Interactive Map of Lithuanian-Jewish Ghetto

vilnaLooking this week at Revilna, a website project that chronicles life in a Jewish Lithuanian Ghetto, using a number of sources including photos, texts, letters, and of course, digital maps. It has hundreds of historical “points” pulled from memoirs, archives, artifacts, and accounts of inhabitants.

It has a well put together illustrative narrative delivery system that allows you to “play” stories and having the map highlight points which are then explained on the left side of the website. The user can follow these built in stories to learn about the education, health problems, resistance, life in the Ghetto, the formation of the Jewish Councils, and the formation and liquidiation of the Ghetto.

It draws from the point-of-view of the Ghetto inhabitants but the narrative is distinctly that of the web creators as they include lots of information that Ghetto inhabitants would be unlikely to have knowledge of such as very specific arrest records.

The only complaint I have is that the map feature is relatively unnecessary unless you are trying to answer very specific research questions about the Vilnius Ghetto such as where people went to work, or the geographic proximity of events such as arrests, siezures, and disease outbreaks. Otherwise the map serves as a bit of a distraction to the narrative of the individual stories.

Digital Dynamics Across Cultures – Week 9

Digital Dynamics Across Cultures

Screen Shot 2015-11-16 at 5.27.37 PM

Made in 2008, the site, Digital Dynamics Across Cultures, created by authors, Kim Christen and Chris Cooney, and designed by Alessandro Ceglia, is a really beautifully made interface, with a modern sleek approach that focuses on the anthropological narratives of the Warumungu people. It opens with a sliding transition that proves its interactivity with the browser as well as its beauty in the little details. The opening of the site starts with a welcoming introduction pop-up that explains Digital Dynamics Across Cultures as “an interactive project focusing on the cultural protocols of the Warumungu people from Central Australia” and immediately the viewer can understand that the site is a socio-cultural and anthropological analysis through the vehicle of web interface.

Screen Shot 2015-11-16 at 5.27.46 PM

As soon as the viewer clicks off the pop-up, visualizations of bubbles appear that represent the “territories of cultural and political important to Warumungu people.” Upon selecting a bubble, it opens a new site of information, pictures, settlers, schools and the lives can be accessed/seen/read. With the tabs, the user can also read further on the networks built amongst these cultural territories through the “tracks” and importance of a variety of protocols in which the Warumungu people ensure that their culture is maintained properly. This made the entire navigation experience simple, exploratory, and overall, enjoyable, especially as a designer.

Screen Shot 2015-11-16 at 5.28.12 PM

What I appreciate the most about this site is the intentions that the editors had behind their design decision-making processes. In the editorial statement, the team made it a clear objective that this site was “experiential, but it does not presume cultural experience to be something we should take for granted,” making it clearly known that a simplification in a website’s design does not reflect in any way that the culture itself is something considered to be “simple.”

Furthermore, I feel that their design is successful for what the anthropologist are trying to achieve. The team highlights that just because the site is something in which we can view for pleasure, this in no way should mean that the Warumungu culture is for the “tourist’s gaze” as well. Therefore, the development of the website articulates this concept well, for it refuses to make the site a product of commercialism, with such an earnest design and ad-free page. The site purely provides the materials in hopes to give others the opportunity to explore the smallest sliver of the Warumungu culture.

Elena Cullen – Mapping

For this week’s blogging assignment I chose to look at the Digital Harlem map. The map examines everyday life in Harlem form 1915 to 1930. The project uses maps to indicate where specific incidences occurred such as arrests, abortion, and baseball games. The first problem I had with the map was why the project only explores Harlem from 1915 to 1930. This specific time period seems somewhat arbitrary without a further exploration as to why this period was important. The project then goes on to state that the map focuses on “ordinary African New Yorkers,” however it provides no standard for what this is. The only definition of what an ordinary African New Yorker is what it is not. The project claims its map is different because it dose not focus on black artists or the black middle class however my first thought (with no real research backing) is that the black middle class could be considered the ordinary African New Yorker. The word African is also a very vague term. I’m assuming the author uses this term discuss the lives of black African-Americans however the term could also be applied towards say white Africans who have relocated to New York.


Screen Shot 2015-11-16 at 1.46.42 PM


When using the map itself I was somewhat confused. It has almost too many search parameters. For example, if you wanted to look at the number of tennis matches between July 1915 to August 1922 fields such as “charge/conviction” would be irrelevant. I also believe there is almost no instance where knowing he number of tennis matches that occurred in a specific time period would be of importance especially when very little information about the event is provided. Some of the events you can search for are also very vague. One type of event is categorized as a “Baby Farm.” I have no idea what that is and I feel like others might not as well. “Receiving Stolen Goo” is another search term that I cannot comprehend its meaning. I also wish the site elaborated more on why the specific location of the event is important. Though it is obvious how it can help to have the location for an academic project it would be nice if the site gave an explication so that younger viewers could better use the project.


Overall, this project has very little information other than specific locations of when events occurred. I feel that it would better suit the need of academics by adding more information and explaining the importance of the events it highlights.

Locating London Lives

This week I looked at how 16th Century London could be mapped in order to provide geographical reference to other urban data from other sources. To do this, they needed to combine maps dating from different centuries so that they could accurately georeference data points.
The oldest map they used was illustrated by John Rocque in 1746, and is considered to be the first reliable map of London. It originally came in 24 different ‘plates’ and was required to be pieced together by hand and using photoshop. During the copying of the original map and printing process cause small variations in the edges of the maps, “Minute magnifications” needed to be made in order for the pieces to fit together. For this reason, this map reflects the points of view of both Rocque and the researchers. While indeed the researchers strived to be as impartial as possible when making assumptions about how map edges should align, there is an unavoidable human choice factor. Obviously, however, this map most strongly reflects the assumptions and points of view of Rocque.
In order to provide accurate modern scale to the map, it needed to be georeferenced using an officially accurate Ordinance Survey map. OS was the first organisation to accurately map areas to scale and produce detailed maps of Britain. Soon after the birth of Ordinance Survey, a to-scale map of London had been produced. Yet the OS map used during the georeferencing was from 1869-1880. Using major intersections of lasting roads, the research team was able to overlay the maps onto each other. Owing to the combination of Rocque’s poor instrumentation and measurement and imperfections in the researcher’s printing process, Rocque’s map ended up being warped. While this first appears to be obscure, it is the most accurate depiction of London using Rockies illustration.
This project was particularly impressive to me because I was born and raised in London and was eager to try to find some of my favourite contemporary locations and see how they appeared almost 500 years ago. My high school is on the map, and even though my house is in (West) Central London, it is unfortunately excluded. Thanks, Rocque!

Exploring the Vilnius Ghetto

reVilna is a digital mapping project of the Vilnius Ghetto – a WWII Jewish ghetto in Vilnius, Lituhania that was operated by Nazi Germany. The Kickstarter-funded project was created independently by Menachem Kaiser, a researcher/writer studying post-Holocaust narratives in Eastern Europe at Columbia University, with the help of YIVO, a Jewish research institute.  According to Kaiser’s Kickstarter page (it’s a shame that I couldn’t find this information on the website itself),  the project aims to reimagine the space of the Vilna Ghetto and allow users to digitally explore the ghetto through various mediums – text, original documents, images and a map.

Screen Shot 2015-11-16 at 1.31.36 PM

The map reflects the point of view of the ghetto’s Jewish community. The points on the map, which are paired with historical photographs, indicate significant events that shaped the lives of the Jewish residents in Vilna. The narrative starts with the formation of the ghetto, detailing the segregation of Jews  that was put in place by the German authorities, and goes on to explore the decimation of the ghetto population and the lives of the residents henceforth. The website also features photos of Jewish residents being tortured by German soldiers, as well as original documents like German military reports supporting the brutal treatment of Jews by German authorities. As a whole, the map reflects the assumption – or more like a self-evident truth, based on the historical documents provided – that the Jewish population was brutally killed and inhumanely treated by German authorities during WWII.

Screen Shot 2015-11-16 at 1.27.16 PM

The map reveals that despite the tragedies and atrocities the residents of Vilna faced, they were able to carry through and create a distinct culture of their own. They had a vibrant art scene, which flourished in the neighborhood theaters, and circulation of information about health and safety was fluid between community members and health institutions like the hospital, pharmacy and school. What’s less apparent in the map is the context of the events, meaning, how did the political events impact surrounding areas within the community? I think it would have been easier to imagine the influence of the liquidation, for instance, if public facilities and venues were also shown on the map. Unfortunately, they’re only viewable from maps that explore life within the ghetto, art and culture and health and education.

If I were to recreate the map, I would have made the divide between politics and social life less blurred because one has the tendency to spill into the other. This would give users a more holistic, complex view of the experience Vilna residents went through during WWII.

19th Century Caribbean Cholera Timemap

The 19th Century Caribbean Cholera Timemap is both a timeline and a map, locating all documented cases of Cholera outbreak, hurricanes, tropical storms, and news articles in the Caribbean. The top has a scrollbar timeline dating years, with color coded pinpoints corresponding on the map. It seems that a Google mapping tool was used for this particular project.

This map follows the point of view of the mass media, as the the hurricanes and tropical storms are by pure if/not happened, but the news articles are from major journals and newspapers from the time. Whether its original in English, or translated, they are written for the public. This map assumes that all cholera outbreaks are recorded, however, it is not inclusive of every case. This contributes to our class discussion earlier in the quarter on “if it’s not documented, did it actually happen?” When a viewer looks at this map, they will assume that these are all of the hurricanes, outbreaks, and storms that existed over the decades of years. However, it is very likely, considering the location and the time era, that there are many cases that went undocumented, therefore, are not reflected on this map because there is no way to trace it without a recorded paper trail.

Regarding design, this map is very simple and very straightforward and easy to understand at first sight. The legend, descriptions, and timeline portray the story well. In general, I think Google’s tools, fusion tables, etc, are always a good go-to because it is easy to navigate and very familiar for most people. However, for this map, I feel that another mapping tool, perhaps could have been used like CartoDB. There are more functions than Google, with more variation in mapping visuals and adding filters. Because the records are of long periods of time, it is hard to see each year one by one.
In conjunction, I personally did not like the scroll feature of the timeline. I felt as though I was scrolling through ages (literally) to find one period of time. Perhaps some filters not only on the year, but the specific cases (Cholera, hurricanes, tropical storms, news articles) would have been a more ideal choice.

Screen Shot 2015-11-16 at 1.31.27 PM

If I were to redesign this map, something like Mapping the Letters of the Republic, where it is a simple stationary map, with the ability to add years [time], and people [outbreaks, storms, etc] would be a more efficient map. It would still serve as a timeline to fulfill that component, but not be a literal scroll through timeline.

Digital Harlem

For this week’s assignment, I chose to look at the Digital Harlem site which presents information about the everyday life in New York City’s Harlem neighborhood in 1915-1930 using information from archival and published sources.  The interactive map allows the user to search for events, people or places, and then allows the user to click on items found on the map and learn more information about that item specifically.

What kinds of assumptions, and whose point of view, does the map reflect?

The map assumes, or at least makes the user assume, that the site is focused on the black community in Harlem and that the black community plays a significant role in this area.  This is assumed because at the top of the map, there’s the option to see the border of black settlement in the years 1920, 1925, and 1930.  I think the map is most useful for those who are familiar with the area or know people who lived, or live, in Harlem because the map allows the user to search for specific names, even convictions.

Screen Shot 2015-11-16 at 1.09.26 PM

Screen Shot 2015-11-16 at 1.05.42 PM

What does the map reveal and what does it obscure?

The map focuses on ordinary African New Yorkers and reveals information about the crimes committed by these ordinary citizens through legal records.  The map attempts to reveal “reveal all manner of things that would not ordinarily be labelled ‘criminal’– streetlife, black language, music, family life – as well as evidence of the role of gambling, violence and confidence men in the black community”.  However, the About section also says that the project does not focus on black artists and the black middle class, which are large, important portions of the community.  Thus the map obscures the idea of the area and what it attempts to reveal because it focuses on a smaller portion of the community. The map also doesn’t explain the context of the crimes committed.

Imagine and describe an alternate map.

An alternate map could include newspaper articles and pictures of the people, places, and events being searched.  It would also be interesting to see a map of Harlem today to be able to compare.

Older posts Newer posts

© 2026 DH101

Theme by Anders NorenUp ↑