For this blog, I have chosen the short story Enzo Ponza by Joanna Walsh to create my network graph. The network graph that I have made for this short story was honestly harder than I thought. After having done this graph, I realize an edge list play a vital role as to how your graph will look like. Although a network graph software can create a graph for you, it is still up to the creator to decide what connections they want to show, what information to include, what information to exclude, etc.
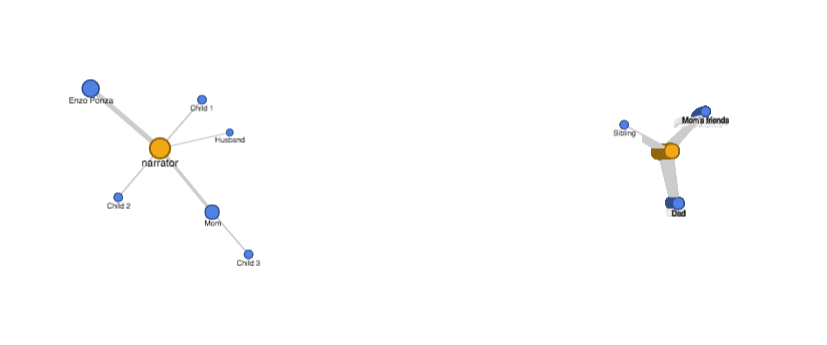
As you can see from the graph, the narrator talks about Enzo Ponza the most as indicated by the thicker lines. This indicates that the narrator is most influenced by Enzo Ponza and she focuses mostly on Ponza. As we can also see, the characters each talk to the narrator the most showing the importance of the narrator to the story. There is a group of characters who has no connection with the narrator because they don’t talk to the narrator in the story. These group of character’s play of little role to the point of the story.
Although this graph can tell the audience quite a bit, i feel like the graph is limited to the amount of information that is inputed by the creator. Some columns were not represented in the graphs because there was not an option to put more information due to the complication of having more than 3 elements, thus limiting possible connection that can tell us something.