For this network graph activity, I read Josh Weil’s short story “One Ridge Over,” which is a first-person narration of Weil’s experiences living in a mountain valley. The way I constituted a connection for the purpose of my network graphs was from the Weil’s (the narrator’s) description of the characters, which indicated their relationships. While there were scenes with character interaction, there were many more characters mentioned that could not have their relationships defined by interactions, like the Woodsman’s mother and Junior. It was also not feasible for me to base connections on dialogue, as there is really only dialogue between three of the fifteen people mentioned in this story. Therefore, I used Weil’s mention of specific relationships, but also had to extrapolate for some. For instance, I assumed that Sis and Junior had a connection because Weil said they were married, even though the text of the story does not show the two of them interacting. This did lead to some tricky situations. In the case of Russell’s wife and son, I could assume that Russell’s wife “knew” her own son because she gave birth to him; however, Russell’s wife had been gone for twenty years and there is no indication if she was there to raise her son. Therefore, I decided that she had a connection to her son, but that her son did not “know” her, because it was never explicitly mentioned.
Below is a (small and blurry) screenshot of the main network graph I created – clicking on it will take you to the Google Fusion table itself which is easier to see. This graph uses directional arrows to indicate connections, and the larger circles indicate that the person is more well-connected. This graph shows that Weil is the most connected of any character (which makes sense since he is the narrator and everything is told from his point-of-view), and that Russell is the second-most connected character. It also demonstrates some holes in interpreting Weil’s narration; Mattie Jones and her husband are separate from the network graph since they are not mentioned to have known anyone else except each other, though it could be very likely they did know other characters in the story.
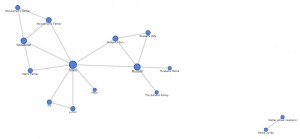
However, I think this graph has issues. Foremost, I am unsure how the directional arrows were determined because each edge only uses a single-direction arrow. This is odd because many of the connections go both ways since the two parties knew each other, which ought to imply that the arrow should point both ways. In fact, the two relationships that should use a single-direction arrow have it pointing in the wrong direction. As mentioned above, my data indicates that Russell’s Wife knows Russell’s Son, but that Russell’s Son does not know his mother – yet the arrow is pointing from the son to the mother in the graph. Additionally, the Sarvers Family was not mentioned to interact with anyone but themselves, though Russell had observed them in their activities. Therefore, I indicated that Russell knew the Sarvers, but not that they knew him – yet the arrow points from the Sarvers to Russell. I might be misinterpreting how this network graph uses directional arrows, but the way the arrows are used seems to conflict with common sense.
I also made a network graph that shows the distribution of gender in the story:
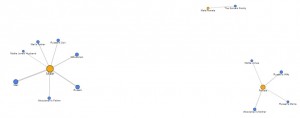
This graph does not show much useful information, and feels especially disjointed because the Sarvers family includes both males and females.
However, using gender, I made another network graph that shows which genders knew which people:
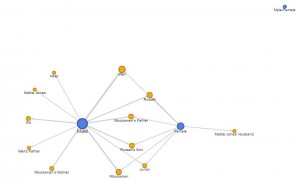
This graph is somewhat useful, as the thickness of the lines pointing to a character indicate the extent of their gender connections. For instance, Weil was connected to more male characters, whereas Russell was connected to more female characters. This information may or may not provide information about character personalities. However, this graph also has its limitations. Once more, the Sarvers family proves to be a tricky plot point because they had members of both genders – in this graph view, they do not even appear, there is just a point for “Male/Female.”
All in all, I think Google Fusion Tables provides a simplistic way to approach network graphs, as it can illustrate basic network connections. However, it does have somewhat limited functionality and aesthetics, and uses directional arrows in a way that contradicts logic.