http://miriamposner.com/dh101f15/index.php/2015/10/19/city-departments-by-payroll/
John Rauch
DH 101 Blog 3
DISC 1C
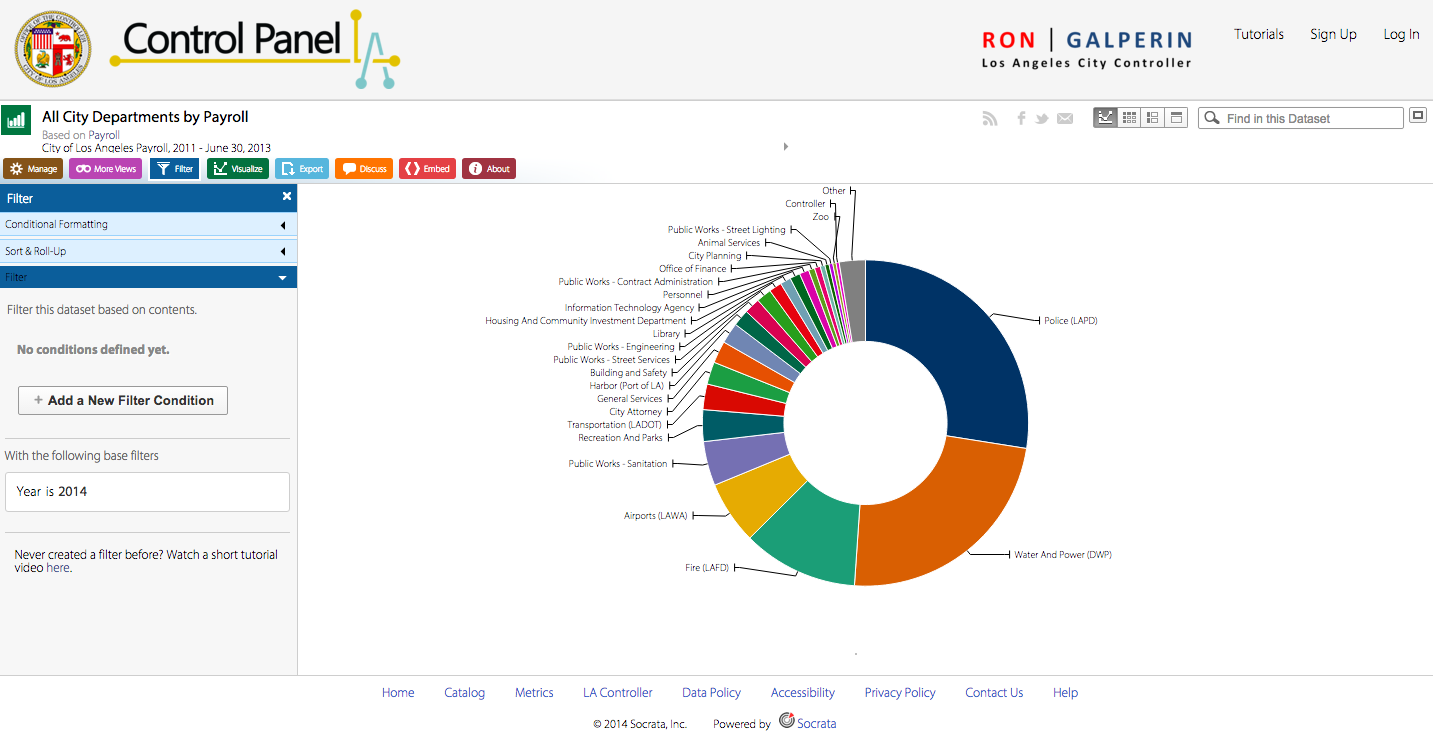
This database addresses how much tax payer money goes to specific city departments in Los Angeles. Essentially, this data is the number of dollars, from taxpayer paychecks, to the accounts of city departments. These number of dollars per department are separated and categorized, and then visualized online via a number of different mediums. Above we see the “donut” shape graph, but there are several more option available.
A record in this data set is a Los Angeles City Department. These departments are owned and operated by the city, so it is paid for by taxpayers in the city to keep the city up to a certain standard (or at least try to). In this case there are about 22 departments, so 22 records in this data. Of course, there is metadata and actual content to drive these records (number of dollars).
Simply put the definition for ontology when it comes to a dataset ” …merely implies a distinction between groups’ mental maps of their surroundings” (Wallack , Srinivasan, 1). This definition can be applied to the LA department payrolls by understanding that this ontology is that of the city’s. By this I mean that the database is created in the point of view of the City Controller, who represents the goals and agenda of Los Angeles. This ontology is different from that of a librarian, a student, a social worker, etc. because ontologies change depending on the mental map of the creator.
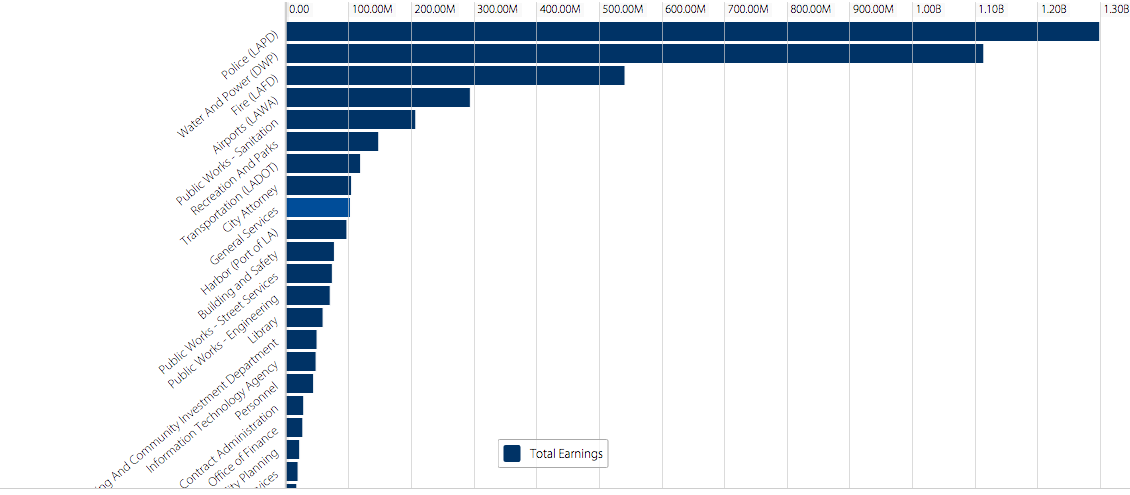
I actually believe that the City Departments will find this data most illuminating. This is because all of the departments can see how their own departments stack up to those they share taxpayer money with. For example, the Recreation and Parks department can see that they receive less than 25% total earnings when compared to the top two department earners (LAPD and LADWP). This may shed light on the employees to consider other city jobs that may pay more due to a higher yield of yearly funds. Although, this data does not show how the money is distributed. Nonetheless, this data would be crucial for employees of the city to see which departments Los Angeles is making a priority.
This dataset can tell us about the importance of certain departments for the city, through the lens of the people actually making the decisions of where they believe the money should be going. The phenomenon of wondering where all the taxpayer money really goes is attempted to be solved here by providing the data of these numbers with digital visualization and filters. While this dataset merely shows the distribution based on fact of records, many conclusions can be come to by inferring why these numbers are the way they are.
What gets left out is specific information about what the departments actually do with their funds. We are not able to see how the money is dispersed to other employees or if most of the money goes to projects and advancement. I believe these details would be the most illuminating in how this money really is being used. My guess, however, is that information will be held from the public eye, as the spending of some departments may be far from the opinions of the citizens. One can only wonder what this money is actually used for.
If i worked for the government for the state of California, and was responsible for comparing all city departments from all counties, my dataset ontology would be much different. Instead of being compared on just the cope of a city, the whole state would be considered. Thus, all these separated departments seen above would have to merge with similar categories from every city, until the county can be entirely spoken for. This data would look much different, be much larger, and illuminate many different conclusion as to how taxpayer money is distributed in California.