Class Blog

Week Three: Payroll By Departments Ontology Analysis

For this week’s blog post, I decided to analyze the ontology of the Payroll by Departments data on the LA City Controller website.  This dataset includes information about the fiscal year, position being paid, the job class title, employment type (full-time or part-time), hourly rate, projected annual salary, each quarter’s payments, base pay, total pay, benefits payments, and more.  A record in this dataset is each of the 33 data types defined for each row.

According to Wallack and Srinivasan, an ontology is “a system of categories and their interrelations by which groups order and manage information about the people, places, things, and events around them.”  I would describe this dataset as being a state data system, with a state-focused ontology.  Though this is from the city controller’s office, Wallack and Srinivasan described that state data systems offer the infrastructure of administration, and in this case, the payroll is at the core of the city’s functionality.

This dataset is clearly published as a way to establish transparency between the city and its residents, so the residents can know how much money goes to each position and can see what the financial priorities of the city are.  When someone clicks on, say, the Elected Officials data, that resident would know how much individual City Council Members are making off of their elected positions.  To further lend itself to transparency, some of the categories are even defined at the top so people know what the data means.

However, this data appears to be left intentionally vague.  For instance, we know that we are looking at a Council Member’s data, but we don’t know which Council Member we are specifically looking at, so if there was an issue in the data, like maybe one Council Member accepted a huge bonus, we wouldn’t know how to hold that one person accountable.  There is also an information overload in this dataset.  There are so many columns of information, it would overwhelm a resident looking for information.

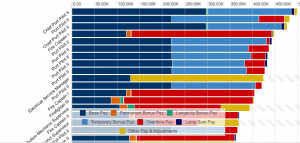
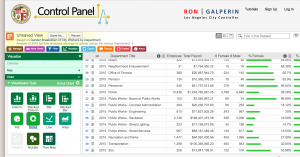
Another issue with the presentation of this data is in its visualizations.  When you open the dataset, its first visualization is a pie chart of each department and how large its percentage of the overall city payroll is.  It only tells you the amount of money paid in payroll to that department, but gives no context as to the makeup of that department.  A resident would have to delve into the depths of the data to understand that, which is time consuming, overwhelming, and unnecessary.  Perhaps if more information had been put into the data visualizations, they would have been more useful.  What is clear in them, however, is what the city wants to project as its departments of priority.  A city resident could look at the data and be pleased that the city values keeping its citizens safe and healthy, with police, water and power, and fire earning the most payroll.  While these are major categories earning a lot of money, there is also departments like “Harbor,” but the visualization offers no explanation about the department, what it does, or who is being paid the over 97 million dollars listed.

If this were coming from the residents of the city, the information would look a bit different.  The main focus might be on positions of power, how much they are making in total, how much work they are actually putting in, and how this relates to other cities and the overall city budget.  I would be wondering how much of my city funds are going to these individual positions, especially with the public positions earning in the top 1% of the country.  I would want to be answering questions regarding why and how my money is going there and its effectiveness rather than simple numbers about what percentage over base salary it is.

Week 3 Blog on “City Payroll Data”

The dataset I select today is the City Payroll Data, which includes quarterly payroll information for all Los Angeles City Departments since 2013, updated by the Los Angeles City Controller’s Office. As displayed in the spreadsheet, the data are assorted according to various types: types
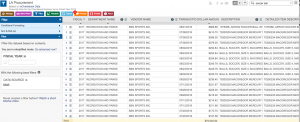
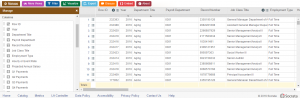
Row ID, Year, Department, Title, Payroll Department, Record Number, Job Class Title, Employment Type, Hourly or Event Rate, Projected Annual Salary, Q1 Payments, Q2 Payments, Q3 Payments, Q4 Payments, Payments Over Base Pay, % Over Base Pay, Total Payments, Base Pay, Permanent Bonus Pay, Longevity Bonus Pay, Temporary Bonus Pay, Lump Sum Pay, Overtime Pay, Other Pay & Adjustments, Other Pay (Payroll Explorer), MOU, MOU Title, FMS Department, Job Class, Pay Grade, Average Health Cost, Average Dental Cost, Average Basic Life, Average Benefit Cost, Benefits Plan and Job Class Link. While there are 285008 rows stored,  a record in this specific dataset refers to the aforementioned profile of a department in the city.

Wallack and Srinivasan, in their writing, suggested that the ideological effects of the way in which sources have been divided into data could be recognized as either meta-ontology or community ontology.  Since the dataset is clearly collected and uploaded by Los Angeles City Controller’s Office, there is no doubt that it is an information system operated by the state.  Reflected through the design of certain data types is the official perspective that creates this dataset:  Average Health Cost, Average Dental Cost, Average Basic Life and Average Benefit Cost are all calculated as expenditure from the government, instead of the real costs of the citizens.  Thus, the current dataset caters to purposes of budgeting and shows less concerns from the community.  It makes the most sense for officials who are monitoring the annual expenditure as well as analysts interested in policymaking and institutional design.

On the one hand, this dataset demonstrates a detailed, official payroll information of all Los Angeles City Departments; on the other hand, however, it fails to evaluate the effect of the payments on workers. To compensate for its shortcoming, I would try to shed some lights on the well-being of the community : for example, tackling income inequality will be much easier if the dataset contains the distribution of salaries among different gender, race and ethnicity in the same department. Similarly, comparing people’s average spending on health related issues to the corresponding payment from the government will make more sense than a unilateral payroll information.  By and large, more community concerns can be covered with this approach, and the dataset can present more than one perspective although mostly applying meta-ontology.

Week 3: Payroll by Job Class

This week I decided to explore The Payroll by Job Class data set located at the LA Controller’s Office. The data set is a comprehensive collection of payroll information from Los Angeles City Departments dating back to 2013 to present.

The data is organized into 34 different categories including year, department title, payroll department, job class title, employment title, hourly/event rate, and projected annual salary. A record is constituted by a single individuals profile on his or her payroll information. However, individual names are not given and instead record numbers are assigned. There are 285,008 rows included in the data, and are arranged alphabetically by department title starting at 2016 and moving down in the same alphabetical order to 2013.

In Wallack and Srinivasan’s Local-Global: Reconciling Mismatched Ontologies in Development Information Systems, they state that a state ontology “sheds much of the local context in order to ensure tractable management for policy purposes including taxation, defense, provision of infrastructure and service, and economic management”(2). In short, because state officials manage the data, the information mainly exists for political reasons such as policy creations or revisions. A data set such as this Payroll collection is useful mainly for officials within the Los Angeles County, as they can have easy access to their employees’ salary information if they ever need it for taxation reasons, etc. The data set simply tells whoever is looking at it detailed numerical information about LA County job salaries.

What are left out from this data are specific details about the different jobs within the departments that account for wage differences. For example, in the Aging department, Senior Management Analyst 1 earns $53.46/ hr. while Senior Management Analyst 2 makes $66.23/hr. No differences between the two jobs are given besides one being called 1 and the other 2. Missing details like this make it unclear whether employees are being discriminated by being paid less for the same job or if there are actual differences between the two jobs that make one more difficult than the other, thus creating the wage difference.

If I were to write the ontology over with a non-government point of view, this data may then become useful for someone who is considering job within the county and would like to see how much he or she would be paid for said job. In a lot of cases, a major deciding factor for pursuing a career would be if the salary were high enough or not. This data set could easily help someone determine whether she wants to pursue a certain career or not or even give ideas for different careers based purely on the salary.

Blog 3: Police Expenditures

For this blog, I decided to choose and explore the police expenditures dataset which details the financial data of police expenses from June 2011 to January 31, 2014. The data types are as follows: ID number, Fiscal year, Department name, Vendor name, Transaction date, Dollar amount, Authority, Business tax registration certificate, Government activity, Fund group name, Fund type, Fund name, Account name, Transaction ID, Expenditure type, Settlement/judgement, Fiscal month number, Fiscal year-month, Fiscal year-quarter, Calendar month number, Calendar month/year, Calendar month, Data source, Authority name, Authority link. Along with these columns, there are 226,210 rows of detailed expense transactions. The record in this data set is the total sum of all police expenditures which amounts to roughly 4.86 billion dollars during the aforementioned time period. Additionally, this dataset keeps record of each expense transaction made by the police department which makes it easier to determine the proper allocation of the money into/from appropriate funds.

As Wallack’s and Srinivasan’s definition of ontology suggests that it “merely implies a distinction between groups’ mental maps of their surroundings”, a dataset’s ontology is the transparency of links and boundaries which allows us to further understand a given dataset (Page 2). In other words, a dataset’s ontology is essentially ways in which a dataset’s connections can be recognized and traced. Similarly this dataset’s ontology allows for transparency and understanding of the funds being used by the police department. For instance, it can be reviewed to make sure that no illegal expense transaction occurred or for simple accounting purposes. This data can be helpful to those government agencies that have to estimate the amount of money that should be set aside for the police department from the budget. It creates accountability by both government and public. It also increases transparency for the tax payers who can track their tax dollars at work. It organizes which fund the transaction is to pull money from. It also keeps track of which officer is submitting the expense.

This dataset can be organized in many different ways to provide more information. It can give you a lot of information about where or which vendors the department spends most or least of its money to help understand where the resources are being pulled. The expenses range from cellphone bills to water bottles. You are able to prioritize whichever column you want allowing you freedom to organize the data in any order.   Dataset can tell us exactly where the department is using its money and can be helpful in times of budgeting.

I think what got left out was more details. The dataset uses a lot of broad categories and at times uses the same type for many different transactions. For instance, the expenditure type “supplies and other services” is repeated for more than half of the items. It would help to create additional subcategories to keep the data clean and legible.

If I were starting over with data-collection and describe a completely different ontology, I would create more data types in order to organize the data even more. For instance, I would break up “supplies and other services” to additional data types which would further organize data and specify which commodities were purchased and see if I can’t put those into a separate category or data type. I would also add data types showing different communities or regions of LA and the money being spent there. Therefore, if we are policing in one area more than another resulting in overspending resources in one area, we ought to address the underlining issues of such a region and explore the true cause of turmoil there instead of simply over-policing and overspending.

LA Controller: City Budget Expenditures

The City Budget Expenditures data consisted of financial data shown by the budget fiscal year since 2012. It includes the Los Angeles City Budget, Adjustments and Expenditures as the LA City Controller has documented. Its data types are the Budget Fiscal Year, Department Name, Fund Name, Account Name, Adopted Budget, Total Expenditure, Budget Change Amount, Budget Transfer In Amount (increase in appropriation to account by transfer in of funds), Budget Transfer Out Amount (decrease in appropriation to account by transfer out of funds), Total Budget (appropriation account amount net of changes and transfers to/from the original budgeted amount), Encumbrance Amount (obligation or commitment to pay for a good or service), Pre-Encumbrance Amount (Anticipated obligation or commitment to pay for a good or service), Budget Uncommitted Amount (Total unused appropriation after expenditures and encumbrances), Account Group Name, Fund, Account and Department Number.  Then, for all the budget information, there is a total section that includes the total money spent for each of the budget categories. A record in this dataset is each expenditure a department makes and the changes that they make to their budgets. This is important in seeing how they allocate and spend the funds provided by the city of Los Angeles and taxpayers’ money.

Wallack and Srinivasan’s definition of ontology clearly indicates that it is “systems of categories and their interrelations” (Wallack and Srinivasan, pg.1) that people use to deal with information and understand the world around them. This dataset’s ontology creates an understanding of the money that is used by the city of Los Angeles based on budgets that are set. It means more transparency of government funds which allows for trust and hopefully ethical and honest expenditures. The taxpayers and residents of Los Angeles would find this data most useful and illuminating. However, I also believe that this data would be helpful for each department’s accounting team and the LA Controller to prepare and keep track of the budgets for that year and the following years.

The dataset can tell us a lot about where our money goes and how it is generally used. Most of the funds go towards resources for the elderly, neighborhood empowerment/ neighborhood councils, administration, salaries, among other things. It also shows that amending budgets based on certain expenditures and re-allocating money is proper procedure as long as each transaction is noted and correct. The way in which the information is provided and the options available, allow for the viewer to interact with the data. There are different tools and ways of looking at the data (visuals), you are able to filter through the data to find something in particular, you can export the information and you can also make comments to discuss with others viewers.

2016-10-17

As far as I can tell, the amounts and expenditures that they list are grouped expending greater amounts ranging between hundreds to thousands of dollars. This means the data that is left out are probably small expenditures that either get grouped into a record or noted in some other way.

If I were to start over with data-collection with a completely different ontology, I would start by using different data types. I would take into account the justifications for certain expenses and be more specific on certain charges, especially for generic expenditures like: travel, transportation, etc. I would also include a section for the aspect that it would pertain to most: health, education, well-being, administration, etc. I think people would appreciate knowing and sorting through these more broad categories for how money is spent It can also give a more general idea of the expenditure areas.

Week 4 — What We Buy

This week I looked at the dataset on what the LA city buys for its residents and departments using taxpayers money. The data can be examined through the procurement dataset in detail and scope, while the first link shows featured data through “data cards“. In the procurement dataset, the records consist of each item bought by the city, and is organized by fiscal year, department name, cost, transaction date, the supplier, etc. On the other hand, the data cards show images of certain items the city has bought more pertinent or of interest to the residents of the city, such as 6,670 soccer balls at the cost of $8,549.

Wallack and Srinivasan describe an ontology as “systems of categories and their interrelations by which groups order and manage” (pg. 1), and such a system discerns information about people, places, things, and events. This particular dataset’s ontology creates a relationship of transparency with the public as to how government funds and taxpayer’s money is utilized and given back to the community. The data cards do a good job of catering to the average users to specify why certain procurements are necessary. Not only that, by visualizing the items bought for the citizens, the City can show the immediate benefits  and the appeal of certain items through images. Each data card is unique in image, description, and even font to appear more user-friendly.

One can click the image to get more information, such as what the item is, why such an item was bought, a “did you know?” section, and a link that leads to the procurement dataset to access the rest of the specific information.

screen-shot-2016-10-16-at-11-35-27-pm
Data Cards provide viewers a visual representation of featured procurements.


screen-shot-2016-10-16-at-11-35-33-pm
This dataset is more detailed through categorization and contains all of the procurements.

Government officials, especially those who are making the new fiscal budget proposals, would find the procurement dataset most useful. Residents who also seek to research extensively and advocate for certain budget proposals and allocation to a program of their interest may also find the procurement dataset useful. However the average citizen would find the data cards more entertaining, interesting, and visually appealing. For example, one might wonder why the city spends thousands of dollars screen-shot-2016-10-17-at-12-06-44-amon soccer balls, but buy clicking the information one will immediately notice that about 81,000 adults and youth participate in the City’s organized sports leagues.

Usually the problem with ontologies, particularly mismatched ontologies, is that there is a tendency to lose information. However I believe the LA City Controller chose well to add the data cards because it fills in the information that is lost in the procurement dataset. Otherwise one might not have known that large frozen rats are bought to feed the LA Zoo animals, and there may have been confusion or unhappy residents with a purchase of frozen rats without knowing why. Of course there is no way to do a data card for every single item bought, and that is where some information is lost. Otherwise, maybe there could be an option in the procurement dataset to click on more information about each item that briefly explains the purchase, not necessarily create it’s own data card.

Blog 3: Top Earners

This week, I looked at data about the Top City Earners from the LA City Controller’s website. This data, as the name implies, looks at who the top earners in Los Angeles are (using data since 2013), plus a break down of their salaries. Its data types are the types of pay (Base pay, Overtime, etc), Pay (in the hundreds of thousands), and occupation, ordered highest paid to lowest paid. One record is the salary of a particular occupation. The record is then broken up into smaller parts in order to more accurately see how the salary gets to the number it is (ie how much is earned from overtime? Bonuses? Base pay?)

When looking at Wallack and Srinivasan’s definition of an ontology, which is primarily “systems of categories and their interrelations” that groups use to establish order and manage information about the things around them. This dataset’s ontology looks at how different types of pay (Bonus, base, overtime etc) can affect the overall total salary a particular occupancy gets. For instance, the base salary of a Fire Captain I is only around $120K, but their total salary ends up just shy of $450K because they were paid around $311K in Overtime, unlike the Chief Port Pilot II whose base salary is $211K, but worked no overtime.

screen-shot-2016-10-16-at-10-01-46-pm

When looking at this dataset, people who would find this ontology the most illuminating/useful would be someone who works with the city’s budget, and would want to know how the funds allocated to pay were being distributed. There are trends that emerge when you look at the top 10 highest paid positions – they work less overtime on average (the Fire Captain I position aside), and seem to make a lot of “temporary bonus pay” (the light blue). Thus, the people in charge of the budget would find the division of types of pay useful for seeing how they affect one another, and if adjustments need to be made.

This data tells us that port pilots seem to make a lot of money (they make up the majority of the top 15 earners), and that while the base pay may not be /extremely/ high, other things such as overtime and bonuses almost double their total salary. However, this only tells us that this phenomena occurs, but gives no indication as to why it is so. Going back to the previous week’s topic of narrative, this collection has no distinct narrative that can be formed from looking at the data.

If I were to start over with the data collection, I would take into account how many years of experience each position requires, as well as how long each person at that particular post has held the position. It would contribute to the ontology by giving reference to how longevity of their time in their particular field can contribute to the type of income they receive.

Week 3: Gender Breakdown of City Workers by Department

From the LA Controller’s Office, I chose to examine the dataset denoted “Gender Breakdown of City Workers by Department.

The source of the data was the city payroll department, which provided information on the distribution of wages as an aggregate, as well as divided between the two genders. The city’s process of organizing this data consists of transcribing the data onto a spreadsheet, uploading it onto the city controller’s website. The dataset was presented using a simple spreadsheet the user can navigate, but there also included the option to view the data through a series of data visualizations (bar/pie graphs, etc.)

screen-shot-2016-10-16-at-11-15-08-pm

*view of the user, notice the many options for visualizations

The record in the dataset consists of the following: the year, department titles, employee count (# of  male, # of female, % of male, % of female), female total salary, male total salary, female average salary, male average salary, % of total payroll to women, and % of total payroll to men.

In Wallack and Srinivasan’s paper, they describe datasets ontologies’ as “systems of categories, and their interrelations by which groups order and manage information about the people, places, things, and events around them” (1). Thus, the city’s ontology for The Gender Breakdown of City Workers by Departments is an attempt to communicate the distribution of wages between male and female city workers in specific governmental departments using a variety of percentages and aggregate wage amounts.

This data is not hard to read, thus it can make sense from many points of view. However, if they city’s goal is to provide an unbiased view of gendered employment within the government, this data raises more questions than answers. I think many feminists groups would find this data illuminating and outraging, for it is clear that women are making far less than men in nearly every department. In addition, government officials can refer to data like this during hiring practices, as well as anti-discrimination lawsuits.

This is where the problem of mismatched ontology comes in. Wallack and Srinivasan write that “States’ attempts to promote ‘development’ are thus limited by the information loss between the community ontologies that define development and meta ontologies that guide their actions” (3). The information “lost” here would be more specific job titles, how long individual’s had been employed, and relative satisfaction one has with their job. I realize this is out of the scope of what the city entailed for this data, but it would go a long way to promoting communication between the community (who may be upset by datasets like these), and the government which is working towards diminishing gender-based discrimination. I believe the city has good intentions in making this data public (many governments would never do this out of fear of lawsuits and citizen complaints), but by leaving out specific job titles, and limiting the data to a single year, they are raising more concerns than answers.

If I was to completely start over with data collection, I would work to provide more data, encompassing multiple years and specific job titles. This would provide a more accurate picture of gendered employment in the government, and whether the disparity between male and female wages is diminishing, bridging the gap between the community’s ontology and the meta-ontology promoted by the government.

Library Items Circulated 2006-2015 (Week 4)

The dataset I chose to work with is “Library Items Circulated 2006-2015,” which is a data visualization in a graphical form of the number of library items circulated, which is based on the “CAFR 2015 Operating Indicators And Capital Assets For Dataviz.” It indicates the text and numbers associated, separated by year, and shown in a final line graph (this constitutes records in this dataset); the number value of each year corresponds to the number of library items circulated, though this unfortunately does not identify what those library items may consist of… this seems to be of a great loss to understanding fully what each library circulates. The values/records range from about 14-16 million. I would have liked to see further insight into what kinds of books are circulated more or less each year.

Using Wallack and Srinivasan’s definition of “ontology,” it is simple to identify that this dataset’s ontology comprises of factual data from the database of the LA Controller’s Office, using their policies, which are not necessarily explicitly mentioned in this dataset. Perhaps the ontology, means of data collection based on values, of the LA Controller’s Office was merely to collect the data in a fair and correct manner, whatever that may have meant to them… Srinivasan in particular uses an organic means of data collection, and aims to collect data from the community members it affects the most. Considering this dataset has to do with library archiving, I would assume that archivists or librarians would benefit the most from this dataset. Perhaps also politicians, policymakers, or unionists may find this data the most useful and illuminating due to being able to allocate funds accurately and fairly to the city’s library workers.

This dataset tells us that though the number of library items took a dip from 2010 to 2013, it looks as though library item circulation is increasing in more recent years, giving me hope that literacy and fact-finding is still being promoted throughout the city and its academic sources. I wonder what kinds of articles, books, textbooks, or archives are included in each year’s circulation. These facts are what is left out the most by this limited data set.

From a grade school teacher’s perspective, I would promote an ontology for this dataset that includes records such as genres collected, and by whom. I would like to know what ages of children are drawn to certain types of books or novels, or other media, and I would perhaps implement this into my school curriculum, to promote reading and high literacy levels. The ontology would include a more specific dataset, as to better understand how the city of Los Angeles could also better include certain types of books for certain age groups and locales in the process of teaching and socialization.

Weekly Blog #3 – Gender Differences by Department Dataset

For the purpose of this assignment I selected the dataset Gender Breakdown of City Workers by Department.  The dataset can be found here.

screenshot-1


The dataset identifies employee earnings by gender across the various city department of Los Angeles.   A record in this particular dataset includes:

  • The name of the department
  • The total number of employees; and the breakdown between male and female in numerical and percentage form.
  • The total payroll spend of the department; and the total and percentage of total payroll spend allocated to males vs. females.
  • The average salary for each gender.

Per Wallack and Srinivasan, this dataset and its meta-ontology would be used to track and understand demographics across the breadth of the different departments in the City of Los Angeles, and to understand the relationships between gender and salary.  There is an aspect of self-policing inherent in the creation and administration of the dataset, with the city seeking to monitor hiring practices and possible imbalances in payroll administration.

City Supervisors, Ethics Committees and Title IX administrators might find this data useful. Regular inspection of this information makes sense as part of ongoing efforts to create gender pay equality and also in hopes of routing out institutional discrimination that opens up the city to legal and moral liability.

The dataset details total payroll spend per department and also the breakdown between men and women, including total payroll spend per gender and average salary per gender. What the dataset illustrates is that with the exception of three departments out of forty, men drew higher average salaries than women.  What isn’t detailed is the length of employment or particular details about the inner workings of each department.  Most permanent city employees receive raises on a regular schedule commensurate with the length of time with the job, so if women joined the department after gender integration, that will have an effect on their salaries.  Pursuant to understanding the inner workings of each department, there is no information of promotion strategies within the departments that might skew results.  The fire and police departments offer regular opportunities to move up the ladder, and each promotion results in a pay increase.  If women are being denied the opportunities to advance, it could explain the lower pay across the board, but the information isn’t here.  I can parse out who makes what, but from the data given, I can’t get insight in to the culture and values of the respective departments.  Women are also subject to physical limitations of pregnancy and maternity leave after delivering, causing them to be absent for longer periods of time from the workforce on maternity pay, which is usually a percentage of their regular salary, and can affect these numbers.

A different ontology for this data would include the average length of employment for each gender by department and would allow for seniority, medical and maternity/paternity leaves. It might be interesting to include information about complaints of gender and wage discrimination per department, also logged by gender, to have a better sense of which departments might or might not be tilted toward favoring a specific gender.