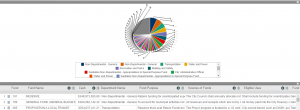
The La Controller’s Office offers a series of data sets that describe the circulation and distribution of funding throughout the greater Los Angeles area. Specifically, I chose to focus on the data set entitled “CD 2 Neighborhood Council Expenditures”. Its purpose is to provide the yearly amount spent by neighborhood councils within the San Fernando Valley. It includes multiple datatypes such as account names( the neighborhood councils allocated to districts within the valley e.g. Van Nuys NC, Valley Village NC, etc); fiscal year, which in this dataset is condensed to the year 2014; and lastly the amount spent by the neighborhood organizations within that year.
The dataset appears rather straightforward at first glance. It shows that “Sun Valley Rec Center Field & Restroom” spent the highest amount in 2014, $357,121, a staggering amount compared to the second highest, which was Studio City at $35,957. What we may infer from this information is based on the digression of our ontological point of view. Having grown up in the san fernando valley, I understand firsthand the economical gap between areas of perceivable wealth and areas of perceivable economic deterioration. For example, studio city and valley village are both wealthy areas. This is supported not only by the dataset expressing that both of these cities spent the second and third highest on community sustainability, but also due to increased housing prices, and overall capital growth of the areas. One does not necessarily need a dataset to perceive the gap between these neighborhoods in comparison to other neighborhoods such as Van Nuys (spending 22,519 annually) , insofar that there are visual differences that describe these gaps. Such differences cannot be accurately or completely described in a dataset.
Wallack and Srinivasan’s essay on mismatched ontologies describes this division between community ontologies and bureaucratic ontological worldviews that may alter and reduce information to fit within a specific organizational system. This divide can lead to and promote already established economical inequality and instability within those communities.
If we look at the CD 2 Neighborhood Council Expenditures” we’ll see that Sun Valley has spent the most in 2014. We may want to infer that this is due to the city’s economical wealth, However this would be leaving out important information. In fact, despite the data shown, Sun Valley is far less stable economically then the cities listed after it. This could be problematic if we look at this data without having a hold on its context.
For example, if neighborhood funding is based on yearly allocated funds, their may be a lack of funding for 2015, assuming that Sun Valley may have spent through their limit. This does not consider the likely debilitating circumstance that may have caused the Sun Valley Rec Center Field & Restroom to spend such a large quantity. As a result, potential future funding may alternatively be provided for cities that are already economically prosperous.


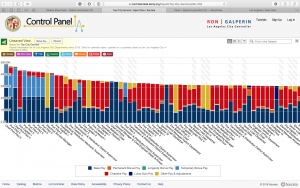 Some people that may find this data useful are city officials who are in charge of the budget, and also taxpayers. City officials can see how much of the budget is going to what positions and how they affect the city as a whole. Taxpayers can see where some of their tax dollars are going, and how the city of LA is paying its workers. I would imagine people would wonder why some positions get so much bonus pay. The job descriptions and years of experience are missing from the data set. This would help to differentiate the positions and give context as to why they are being paid so much. This also helps in comparison. For instance, why does a port pilot make significantly more than firefighters or police officers?