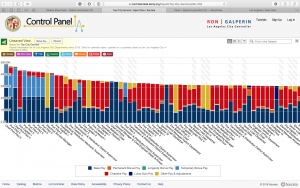
I thought the Top City Earners dataset from the L.A. Controller’s Office would be an interesting set to dive into. This dataset showcases the top salaries for Los Angeles city workers. These salaries are comprised of various factors such as base pay, overtime pay, other pay, and more.
The various data types are the occupations, and the amounts of money they are paid. These monetary values are also broken down into sections. These pieces of data comprise a record with occupation title and total pay. Wallack and Srinivasan describe ontologies as, “systems of categories and their interrelations by which groups order and manage information about the people, places, things, and events around them.” The ontology can be seen in the records for each occupation. The various categories data types add up to make total salaries. But when looking at each position, the data types combine in different ways. For instance, when looking at purely base pay, the Chief of Police and the General Manager & Chief Engineer of Water and Power earn the most. However, when factoring things such as bonus pay and overtime pay, the positions at the port earn the most. Another thing that is quite interesting is that firefighters seem to make the lowest base pay. Often, their overtime pay is double that of their base pay. Why is this the case?
 Some people that may find this data useful are city officials who are in charge of the budget, and also taxpayers. City officials can see how much of the budget is going to what positions and how they affect the city as a whole. Taxpayers can see where some of their tax dollars are going, and how the city of LA is paying its workers. I would imagine people would wonder why some positions get so much bonus pay. The job descriptions and years of experience are missing from the data set. This would help to differentiate the positions and give context as to why they are being paid so much. This also helps in comparison. For instance, why does a port pilot make significantly more than firefighters or police officers?
When approaching this data again, it would be interesting to divide the records by job types such as firefighters, police officers, and port pilots. It would be interesting to see the pay distribution in the individual categories.
I thought many of the points you brought up was interesting because as taxpayers, we can all perceive the data from a community perspective rather than the county’s economically-charged meta ontologies. Your rhetorical questions are a useful starting point in evaluating not just the job position as a whole, but various categories within each role and how it compares to other positions that creates an imbalance – which would likely be overlooked and overshadowed by the overall pay amount. The questions pose simple questions that encourage further investigation into the logistics rather than assumptions about each job.