The website I choose was Locating London’s Past. Locating London’s Past is an interactive website that allows the user to overlay historical data onto maps of the city. The ultimate purpose of the operation was to enable the creation of an accurate point data set. This digital tool allows access to research methods which would normally require multiple trips to the library. There are tutorial videos that explain how to use the site. It is a nice opportunity for anyone doing research to obtain a visualization of the historical data. This is a website where you can find a cross section of information and then plot it on a modern day map. There are 22 of 39 document types that can be plotted. These records include insight into how Londoners lived during the seventeenth and eighteenth centuries.
The site “provides an intuitive GIS [geographic information system] interface enabling researchers to map and visualize textual and artefactual data relating to seventeenth and eighteenth-century London” (http://www.locatinglondon.org/index.html). The interface displays two historical maps — the standard John Rocque one from 1746, and the first accurate OS map from 1869-80, both rendered in impressive detail — and a modern Google map of London. On the left of the screen are the datasets, which cover a wide range of subjects, including parish registers, relief for the poor, voting records, plague deaths, crime records, tax records, court sessions from the Old Bailey, and archaeological records from the Museum of London.
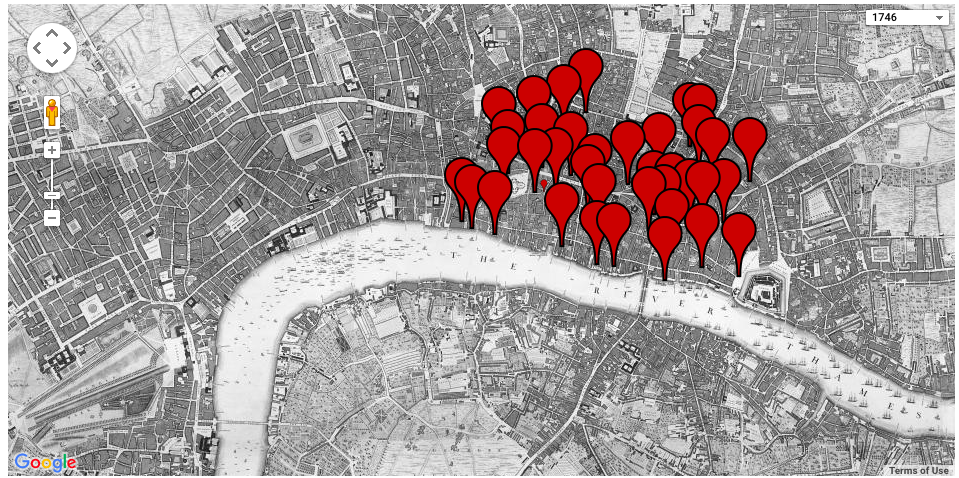
Map of Plague
This is an example of the Plague in London and places where most people had it.
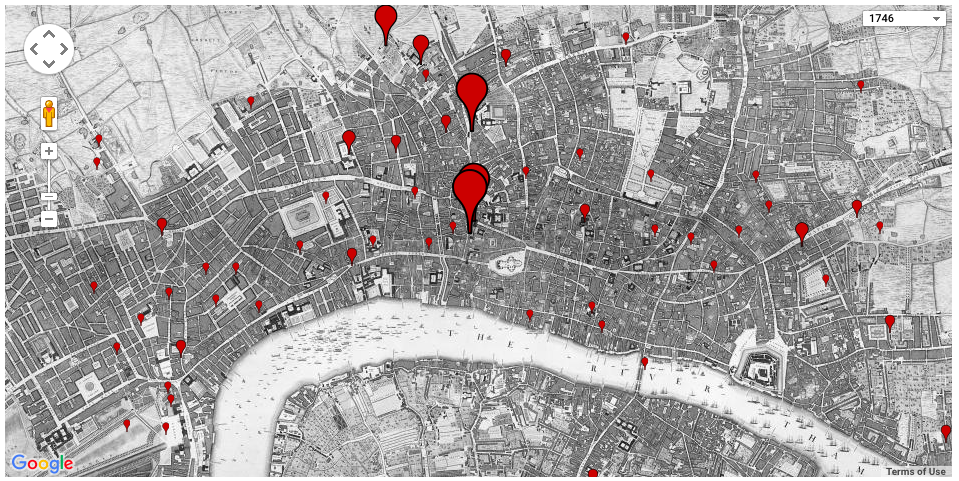
Map of Arrests
This is an example of map of Arrests in London. The bigger bubbles indicate more people who have been arrested in that area and the smaller are fewer arrests in that spot.
The point data provides a valuable resource for researchers of the period, because it allows data gathered by street and parish – tax returns, average age of death, quantity of beer consumed etc. – to be plotted on a map. In short the project has created a resource whereby researchers can more easily engage with the significance of space and location.
I found the Centre for Metropolitan History Datasets fascinating. They included the hearth tax, which was a tax on wealth based on the number of hearths (ovens) in homes, the Coroner’s inquests into suspicious deaths, biographies of executed convicts, hospital records, assistance to the poor by church parishes, maintenance of bastard children records, fire insurance policies, and wills.
I learned that one shortcoming was that the data comes from a wide range of periods, and don’t necessarily correspond to the maps; for example the image above shows plague deaths in wards of the City of London in 1666. This did allow for some interesting comparisons; for example, seeing how the pattern of the city’s population growth in the 18th century was in part influenced by the plague deaths some two centuries earlier.
An alternate map would include additional databases but these are already being considered in future plans for the site. Also, if they could make the map interactive, and when you hover over a bubble for example the Arrests map it would pull up pictures and information about ho was arrested there and their background story. The staff at the Centre for Metropolitan History are currently working on a linked project, Mapping London, which will create a geo-referenced version of William Morgan’s map of London of 1681/2.