I chose to create a network graph for the characters in the short story “The Man at the River.” The story is about an American Man who bikes to a river in Sudan with his Sudanese friend. When they get to the river, the American man is afraid of getting an infection in the water so he decides not to cross. The Sudanese Man crosses the river where his other friend, Friend 2, tells him to have the American Man cross over the river. Friend 2 asks the Fisherman to help them by using his canoe to get the American Man across.
This is my node and edge list excel sheet I used.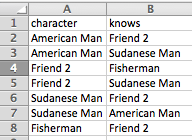
This is the network graph I created:

The nodes are the characters in the story. The edges connecting the nodes are who talked to who in the story. The network graph has limitations because it doesn’t represent the strength of the relationships between the characters. It doesn’t show who knows who better. For example, we do not know how long the American Man knew the Sudanese Man or how long the Sudanese Man knew his other friend. The network shows that the central node of the story is Friend 2 because he interacts with the most characters in the story even though the story didn’t mainly focus on him. Although, the graph does a good job at displaying which characters interacted with each other in this single situation.