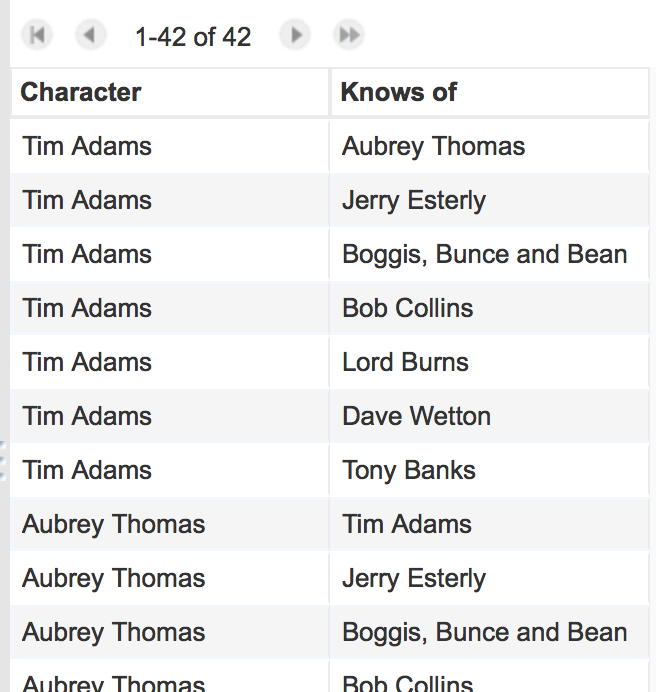
For this week I created a network graph based on the relationships between characters in this true story about fox hunting in the UK written by Tim Adams. To do this I created an edge list of characters. If a character knew of another character, this constituted an edge. Therefore, any two characters could have one of three types of relationships: they could both not know each other, one could know the other (but not vice versa, i.e.. a directional relationship), or they could both know each other.
I had to make a decision whether to ‘suppose’ that some of the characters knew each other, despite this not being mentioned in the script, for the sake of creating a more complex network. For example, I assumed that Aubrey Thomas would know of Lord Burns (Burns is a public figure who has the power to affect the outcome of Aubrey Thomas’s life’s work, but Lord Burns wouldn’t know of Aubrey Thomas, considering he is a regular citizen. Similarly, I assumed that Lord Burns and Tony Banks knew each other, since they were both Members of Parliament.

Above is the network graph. The direction of the edges are shown using small arrows where the edges meet the nodes. They are a lot smaller than I would like them to be, but Fusion Tables was proving to be difficult to customize appearances. This type of network graph fails to illuminate the nature of the relationships. Since this story was one about conflict, most of the relationships in the story are either positive or negative ones. It would be interesting to see if it is possible to add that variable into the data.