I chose to make a network graph for the short story Stars and Stripes by Santiago Roncagliolo in “The Best of Young Spanish-Language Novelists” edition. The story follows a unnamed narrator and focuses on his relationship with Carlitos, the boy who lives next door to him in Lima, Peru, who is obsessed with all things America. Since there was almost no dialogue in this story, I defined a connection between two characters as them having mutual knowledge of each other.
The graph can be accessed online here. (For some reason I’m having trouble embedding the graph.)
I think the most challenging part of making this graph was deciding what constituted a “character” and what constituted a “connection.” Most of the characters are not given names, and there are characters only mentioned in groups or without details like “bodyguards,” “immigration officers,” and a “waitress.” I decided to only include characters who were easy to define as a single entity and who had a clear role in the narrator or Carlitos’ life. I think my representation in the network graph is not quite accurate because, for example, I included the narrator’s cousin who is only mentioned once, but left out the group of bodyguards who were always with Carlitos and his family.
For the connections, it was not always clear who had a relationship with whom. For example, the narrator has intimate knowledge of Carlitos’ father, describing his work, his eventual death, and even telling about how he saw Carlitos’ father walk around the house in his underwear. However, nowhere in the story does it mention the two having any interaction or whether or not Carlitos’ father knows who the narrator is. In this case, I decided that the two did in fact know each other. One could assume that Carlitos’ parents and the narrator’s parents knew each other, but since the story does not mention either having knowledge of the other, I didn’t link them in the graph.
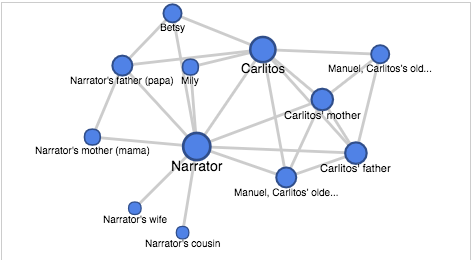
Once I made all these decisions, the process of making the fusion table was very simple. After putting all the relationships into an excel doc, the fusion table put the network graph together just how I imagined it should look, with Carlitos and the narrator as the two largest, most central nodes.