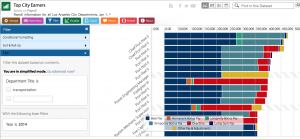
This week I decided to analyze the data identifying the Top City Earners of Los Angeles. This dataset shows the payroll information for all Los Angeles City Departments, from fire chief, to police deputy chief and etc. The data type for this dataset shows each positions salary and salary type, and is organized in a way that you can compare each position with each other. The salary types are separated into categories such as base pay, permanent bonus pay, temporary bonus pay, overtime, and so on. This dataset also has filters in case someone wanted to look more in depth at the information and find out a specific job title’s specific pay in a specific category.
Wallack and Srinivasan described ontologies as a way to look at data and find particular relationships between the different categories. When looking at this dataset, it can be said that the ontology are the different positions and the salaries for each position. This dataset would make the most sense for anyone interested in looking at how much city officials are being paid. As long as you are interested in how much city officials are being paid, the data is relevant and by being able to compare the salaries next to each other, it is also easy to see how different salaries line up next to each other. The dataset is fairly easy to understand and after playing around on the site for a bit it becomes easy to see what the data is showing. The different filters are a little confusing, but after playing around with the site, it becomes better to understand.
As thought out and well done as this dataset is, its not the best way to find out why certain jobs are paid more than others. The data would be more helpful is there was a way to understand why certain jobs make more money than others, as well as what they do in their certain positions. Why does one Fire Captain make more money than the other? What and where in Los Angeles are they working. By adding these constraints, the information would be beneficial to a different ontology.