
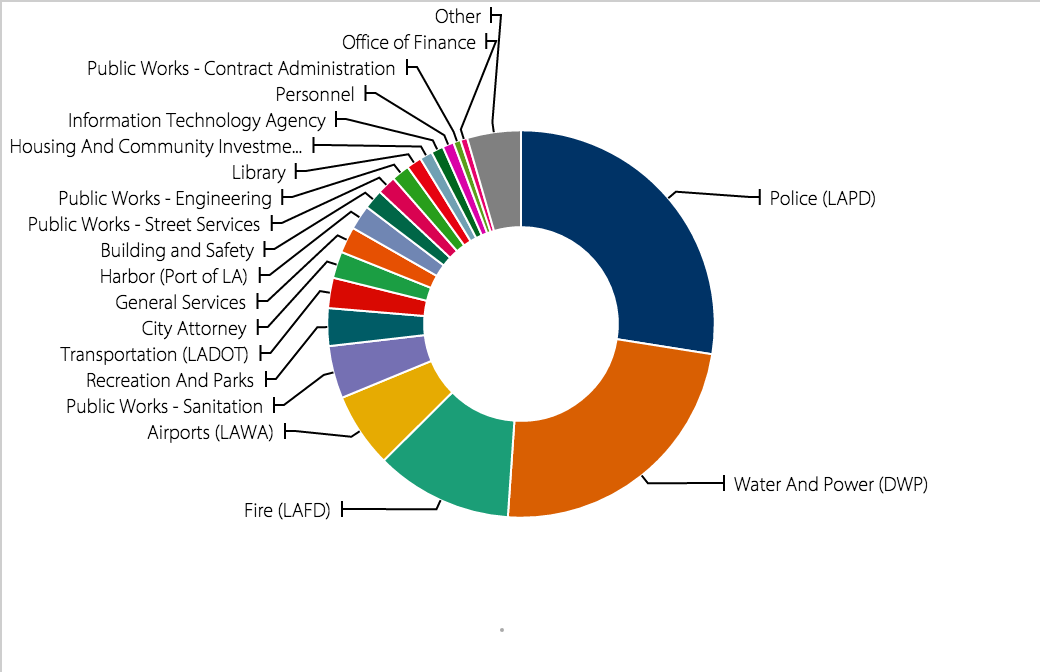
This site gives the Los Angeles payroll by department from 2011 to June 2013. The dataset can be organized/seen in several ways including columns, stacked columns, a bar graph, a stacked bar graph, a pie chart, a donut, a line graph, an area graph, a bubble graph, or a tree map. In this case, a record is each new column or set of data that represents a different department in Los Angeles that uses taxpayer’s money to operate. For instance there is Public Works-Engineering, General Services, Transportation, Fire, etc.
Wallack and Srinivasan argue that ontologies “act as objects that create and negotiate boundaries between groups” and that “communities and states represent the realities around them through distinct ontologies, or systems of categories and their interrelations by which groups order and manage information about the people, places, things, and events around them.” Thus, Wallack and Srinivasan’s definition of ontology applies to this dataset because it organizes the payroll of jobs by department which creates boundaries between the different jobs. The dataset also “represent the realities around them” by displaying the earnings of different departments and, in a way, ordering the departments and stacking them against each other. The point of view that makes the most sense with this ontology are these department workers because they get to see where their department earnings stand against other departments, and the public because they can see where their tax money is going.
This dataset claims it will provide the payrolls of jobs within all Los Angeles City Departments. And from the data we can see that Police (LAPD) earn the most and that the Convention Center earns the least.
The site leaves out background information on these departments and only gives a general idea of where taxpayer’s money is going. It would be interesting to not where exactly the money is going or maybe why that particular department earns that amount of money.
If I were to start over this data collection, I would subcategorize the departments into specific jobs within these departments so that viewers could see within each department what each jobs earn. This could be extremely useful for people looking for jobs or for people deciding what career path to take. I would also attempt to show where the money earned is going so that the site could be more informative to the public and they can see where their money is going and to who.