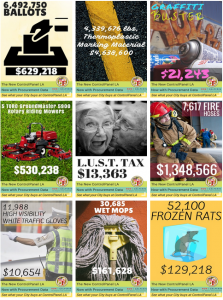
 What We Buy shows fifteen things that are bought by the LA City. While it is not specified on the website, it is assumed that these are the fifteen items that the most money is spent on. The data is broken down into the items listed are helicopters, motorcycles, soccer balls, radar speed signs, ballots, thermoplastic street paint, lawnmowers, the federal LUST tax, traffic gloves, golf carts, basketballs, paint, mops, firehoses, and frozen rats.
When you select one of these items you are given an explanation of the item’s function and why it was bought. This presentation of the data is aimed at the general public that are casually interested in investigating how the city spends its money is spent.
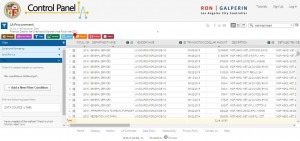
If desired, you can look at a specific item in spreadsheet form where the individual purchases can be examined in detail. The records in this sheet list the item’s exact name, the cost, quantity bought, the tax paid, and the discount received. This spreadsheet form does well present the financial data transparently so that any visitor can easily see which fund was used and even when and where the purchases were made.
Wallack and Srinivasan define ontology as “systems of categories and their interrelations by which groups order and manage information about the people, places, things, and events around them.” The ontology of this data, allowing for the public to see the breakdown of expenses, is targeted at transparency. It is meant to share as much as could be desired from a LA country resident who was looking at the city’s expenses.
An alternative structure that is not used is organizing the data by type of expense such so different categories could be vehicles, where the helicopters, motorcycles, golf carts, and the LUST tax would all be included.
Flaws in the Transparency
While this presentation of data seems to be aimed at transparency, we cannot actually tell what the other expenses the city has. It is deceptive because other expenses are n ot listed or where these expenses fall in the grand scheme of the city’s finances are not put forward. Additionally, small yet important details get left or are not highlighted at least. The time frame for when this data was collected is not clearly defined. For example, with the traffic data, the data was collected from 2011 to 2014 but this only becomes evident when you examine the individual records in the spreadsheet form.