http://miriamposner.com/dh101f15/wp-content/uploads/2015/10/Screen-Shot-2015-10-19-at-9.32.48-AM.png
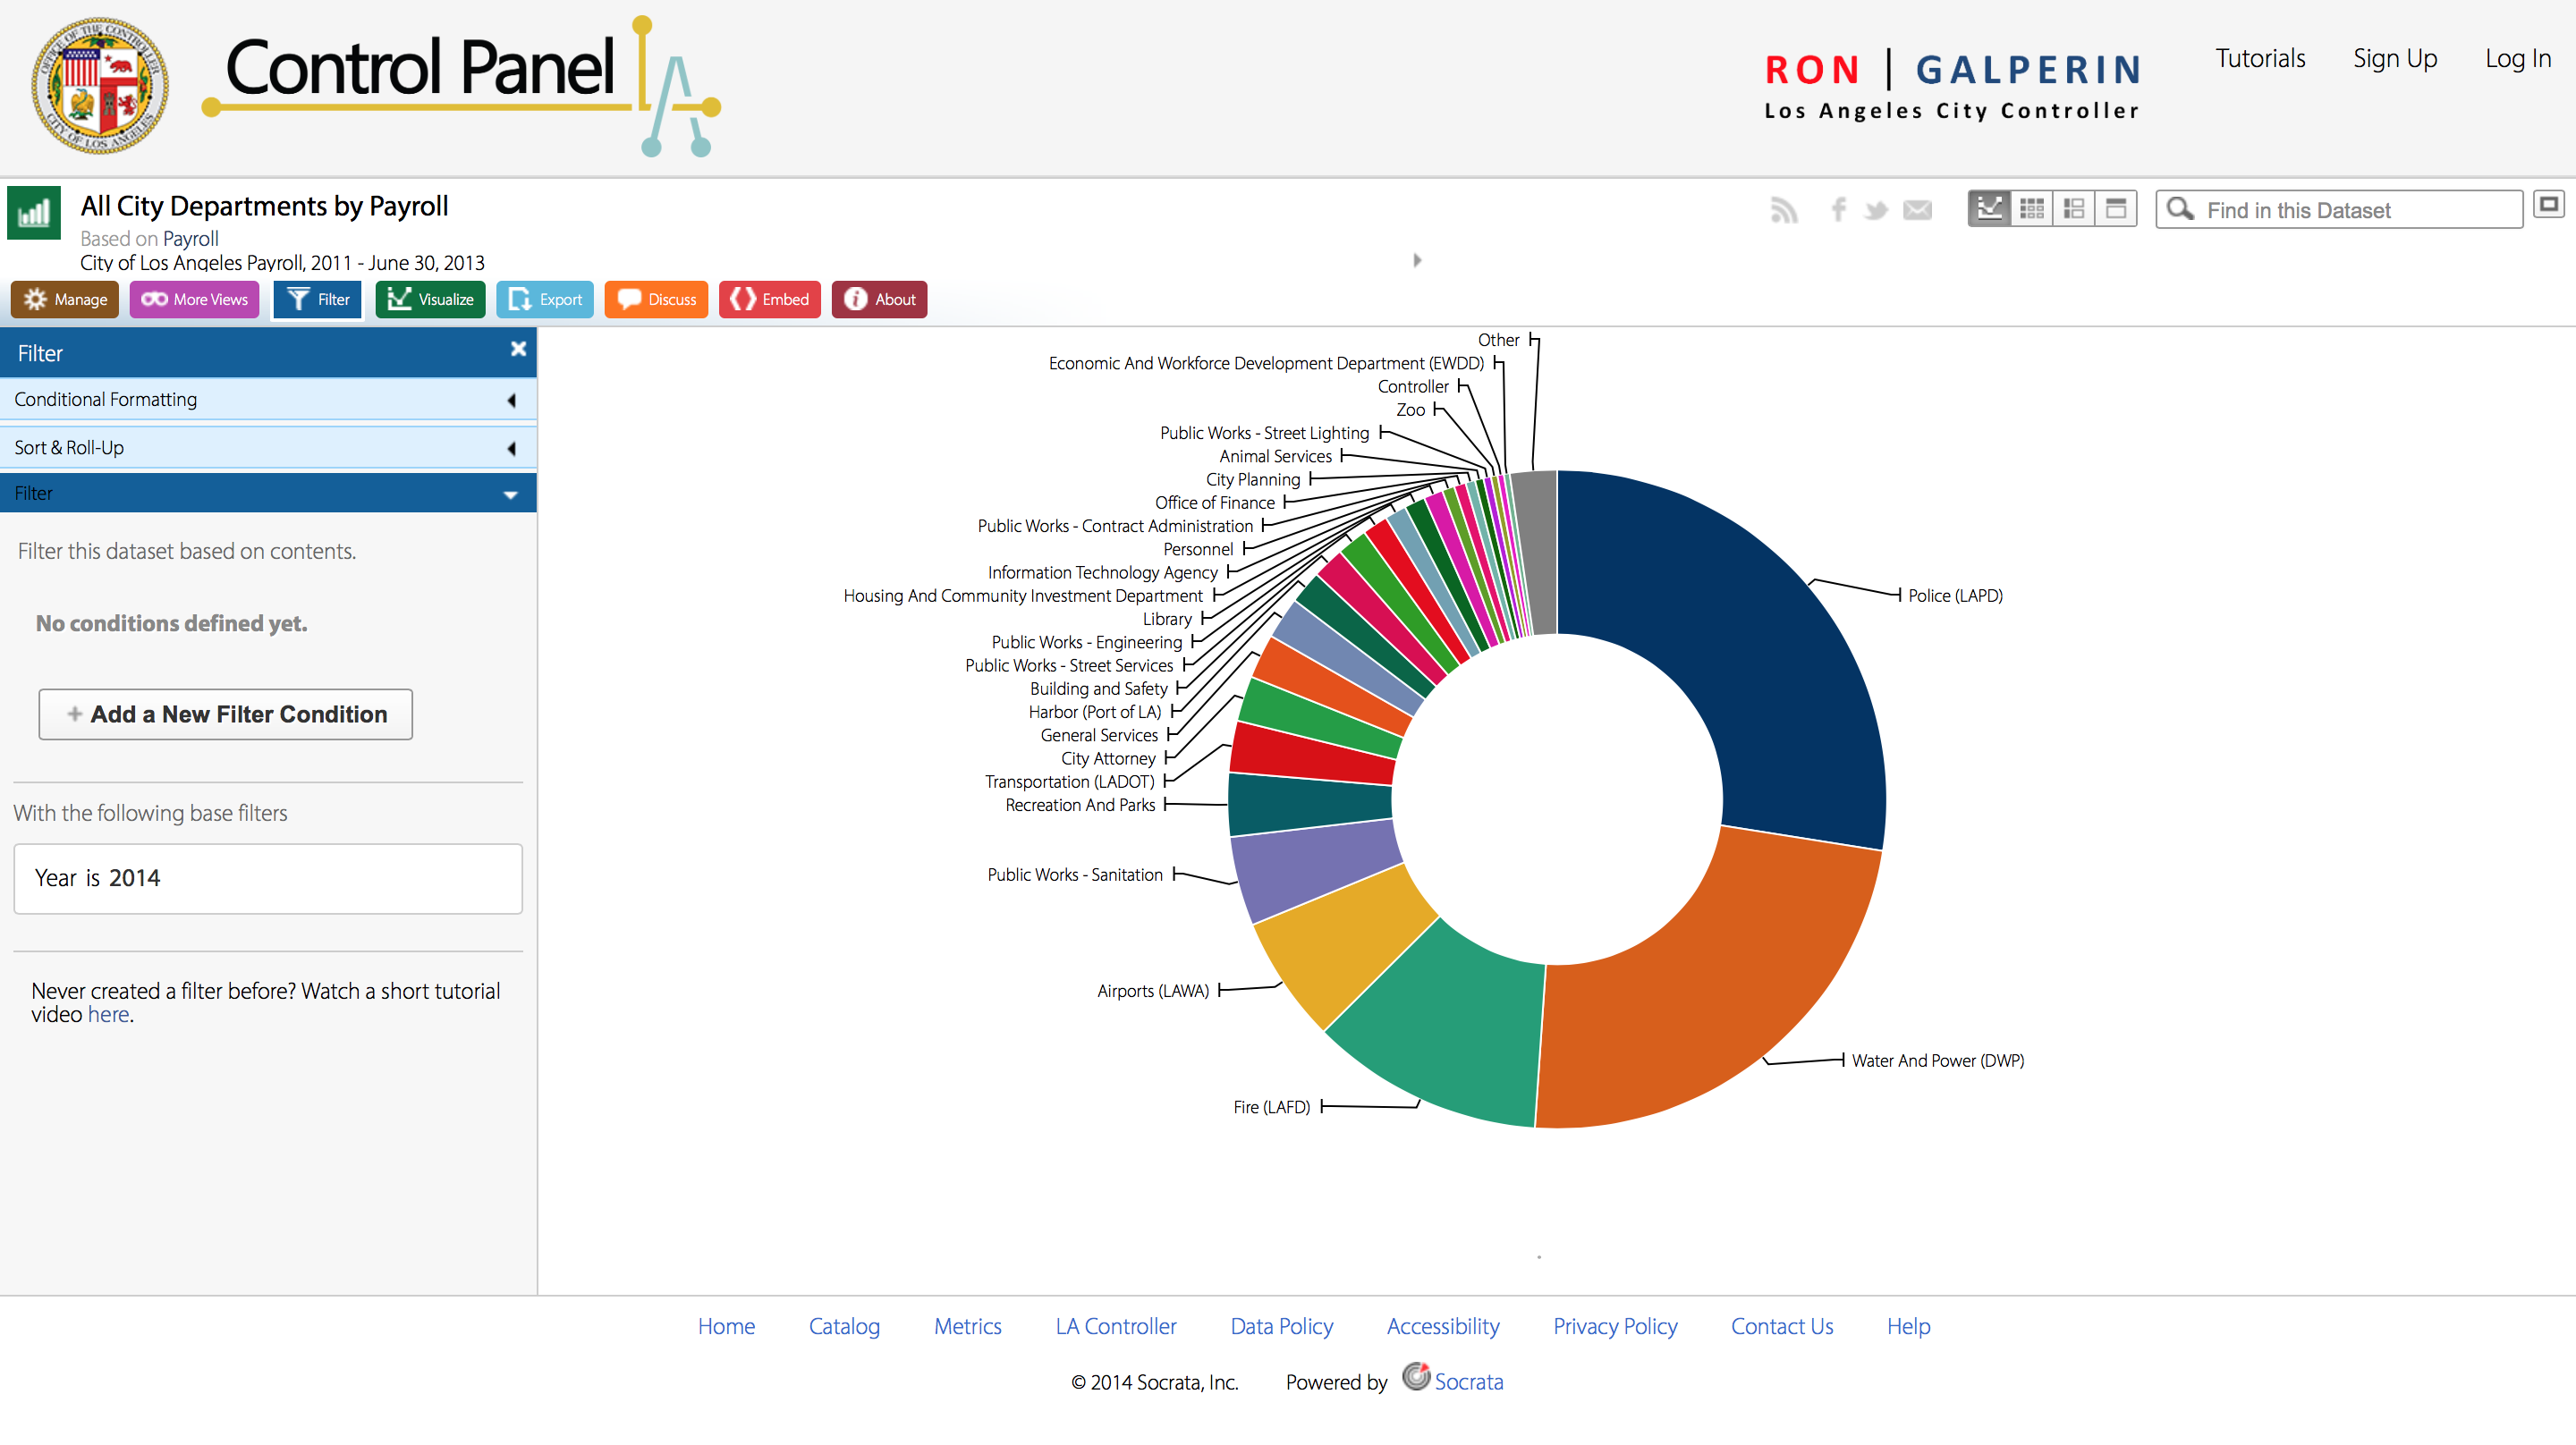
The Control Panel is a website run under Ron Halperin, “an American politician and lawyer… [and, the] City Controller of Los Angeles” from 2011 to June 30, 2013. This site organizes a growing list of the payroll disbursements in the city of Los Angeles, as well as to whom they were disbursed to by job categories. The data of payroll disbursement is made into an interactive format where viewers and user are able to manage filters, different types of visualizations (such as donut charts, line graphs, columns, etc.)
http://miriamposner.com/dh101f15/wp-content/uploads/2015/10/Screen-Shot-2015-10-19-at-9.32.48-AM.png
The data type embedded within this site is the distribution of Los Angeles’ payroll. Furthermore, as elaborated before, the data type lies in the way such information was presented for it was far more important to show the relativity of the earnings from one job to another rather than the actual earned amount itself. When first encountering the page, a donut chart appears that makes it evident that Police (LAPD) and Water And Power (DWP) trumps all the other departments combined. Yet, it provides no numbers immediately until the viewer hovers over the sections.
Each record can be understood as a row of data under the table. Therefore, the record in this data set is the 58 different departments represented in the tables/visualizations.
From my understanding of the Wallack and Srinivasan reading, a dataset’s ontology is the communication of information that help separate entities unify as one construction. With this definition in mind, the Control Panel’s data ontology is the openness of which the payroll disbursement information is announced, so that the public is aware of where their tax money is going to as well as where the government’s priorities lie.
The point of view of which this ontology makes the most sense is most likely, the public eye — more specifically, the tax payers and citizens of the city of Los Angeles. The communication between he government to the people of Los Angeles provides a flow of information that places everyone on the same page of understanding.
This dataset uncovers the phenomenon of where all the payroll money from taxpayers go to, which is predominantly the LAPD — which may be something that not all citizens agree where their money should be spent in the Los Angeles community. However, the information is put out there to share so that we are aware than set in the dark. The information that gets left out is the story or explanation as to why the money is so focused onto the police and water/power, such as a legislation that passed, increase in crime that we should be concerned with, or lack of water resources to fix draught issues.
This data could be in a completely different ontological perspective if it was from the point of the view of the people to the government, like a reserve chart where the people could rate what the individuals feel as more valuable or where they feel their money should go to. Furthermore, the government could be more aware of where the people prefer their money to go and act upon the interest of those they serve.