Identify its data types.
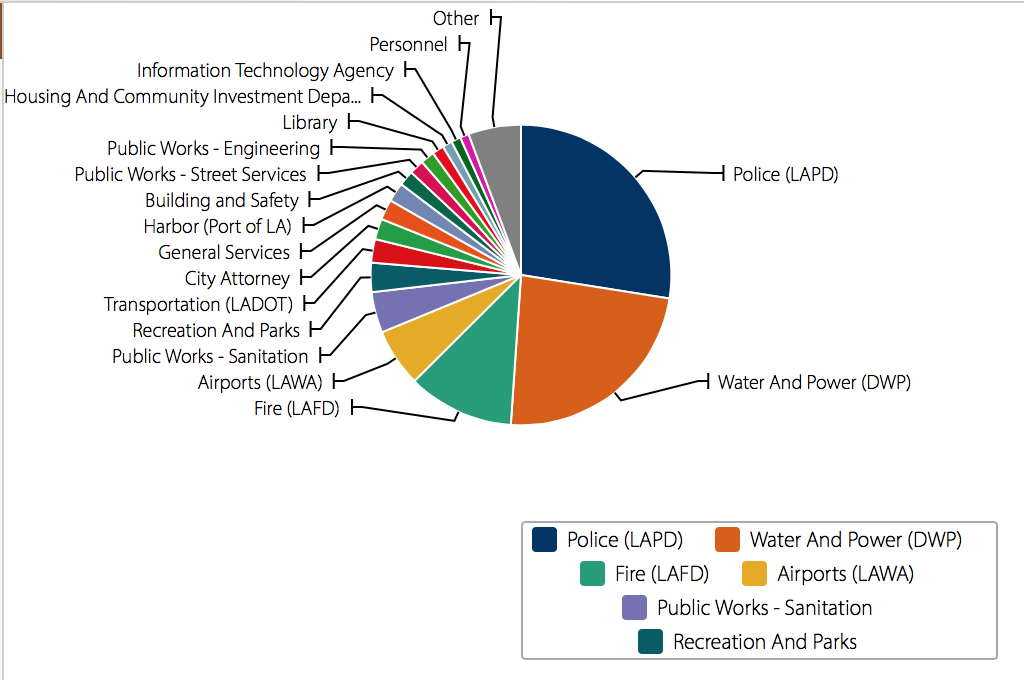
The data presented under “All City Departments Payroll” on The L.A. Control Panel is administrative data representing the total earnings of different departments in L.A. in the form of a pie graph.
What constitutes a record in this dataset?
A record in this data set consists of a department in LA that uses taxpayers money to operate, the total earnings of that department, the year, and earnings over regular pay. Each record is shown as a different color in the pie chart in order to distinguish them, but there are also other graph visualization options in order to see the records organized differently.
Use Wallack’s and Srinivasan’s definition to identify the dataset’s ontology.
Wallack’s and Srinivasan believe ontologies “negotiate boundaries between groups” meaning that official(meta) and community ontologies can tell different stories about the same data. Since the data on the Control Panel was organized and edited by someone working for the government of L.A., this dataset’s ontology regards the states employer’s interest.
From whose point of view does this ontology make the most sense? (Another way to ask this question: Who will find this data most useful and illuminating?)
This dataset seems to be made for the public in order to see how their tax money is being used.
What can this dataset tell you about the phenomenon it claims to describe?
This dataset shows that the police (LAPD) earns the most money and that water and power earn the second most.
What gets left out?
It’s interesting that the data doesn’t show exactly where the money goes within each department. For example, a taxpayer may like to see that the police department has the greatest earnings which implies a lot of money goes into keeping the community safe, but may not like to see that a solid portion of the money that goes into the police department is used to pay firearm trainers . I’m not saying this is the case, but I’m using it as an example to show how limiting the data to showing payroll by department could be strategic by the state.
Imagine you’re starting over with data-collection and describe a completely different ontology, from someone else’s point of view.
A different ontology option for this dataset would be to categorize payroll by job type rather than department. It would be cool to see which kinds of jobs in each department earned the most/least money rather than just by department. Organizing the dataset in this way would be more beneficial for people looking for a state job because they can identify jobs based on skill type than on department type.