This week I chose to analyze the ReVilna mapping project. This project focuses on getting the website user to understand the inception, functionality and demise of the Vilna Ghetto by using an interactive map and timeline to “reimagine” the ghetto which was first formed in 1941.
One unique aspect of this digital mapping project is that it attempts to not only provide the user with relevant information about the ghetto; but, also to attempt to truly show the type of environment and living situations that residents of the ghetto were in. An important feature that contributes to the attempt to put users in the shoes of the residents of the ghetto is the interactive option to “Choose a Story.” This interactive timeline gives users the option of selecting the part of the story which they choose to explore. This is important because the choice to select the order of the narrative can be very useful for humanists exploring and researching a specific subject, such as the Vilna Ghetto. This option is essentially an interactive timeline with images and sub-headings that, when clicked on, link the user to details about the specific time on the timeline (See Figure 1). After clicking a sub-heading, the user is directed to another, even more interactive page with details and information about the lives of the residents of the ghetto, a gallery of images and an interactive map that allows users to explore the geography of the ghetto (See Figure 2).

Figure 1
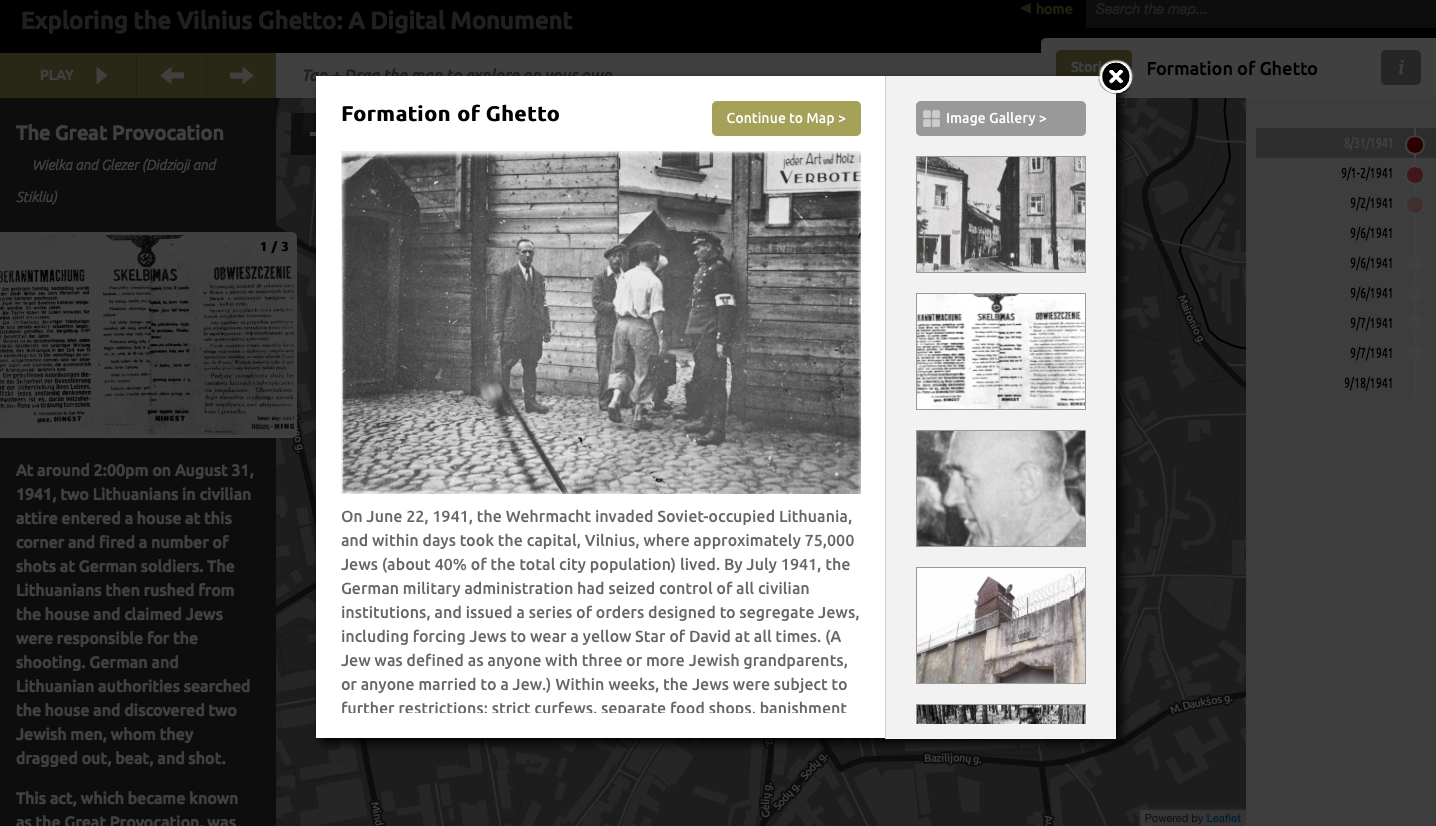
Figure 2
The interactive map found on the links to the sub-headings allow users to explore the borders that were placed for the ghettos. Additionally, the map shows all the street names and avenues written in German. Another interesting feature of the interactive map is the various pink dots found on specific areas of the map. When a user clicks on the dot, it displays a specific story or piece of information that is relevant to the specific location where the dot has been placed on the map. For example, since the ghetto was split into two, a dot on Ghetto 1 indicated that this was the larger of the sector of ghettos and contained approximately 30,000 residents.
Unfortunately, the map obscures specific details of how the streets and buildings looked. There are some pictures in the gallery of specific buildings and the streets; however, a better interactive map would ideally be one that allows a user to not only view the map from a birds-eye view but also to “be on the street,” just as Google maps has done. I’m not entirely sure if this type of information is even accessible but this would be a great way to improve the digital map, even if it was just in certain places on the map.