This week, I chose the story, Introduction: Possession, by Sigrid Rausing from granta.com. In this narrative, Rausing tells a short narrative about her family’s adopted dog, from the time they had adopted him to the time he passed. Rausing describes the passing of her dog and how it brings about a grave sense of ownership, or possession along with death and sadness, which is the theme of the series from this collection.
I took all of the characters in this story and created a network chart on Google Fusion Tables. My network shows simply which characters know who. There are eight characters mentioned in the short narrative, which are (in the order mentioned): the Author (narrator), Daniel (authors son), Leo (family dog), Leo’s breeder, breeder’s husband, the Vet, Vet’s assistant, and Author’s father. They were put on an excel spreadsheet listing all of the connections one by one, making two variables – creating nodes and edges.
I then imported the sheet and created a network table using Google Fusion tables that looks like this.
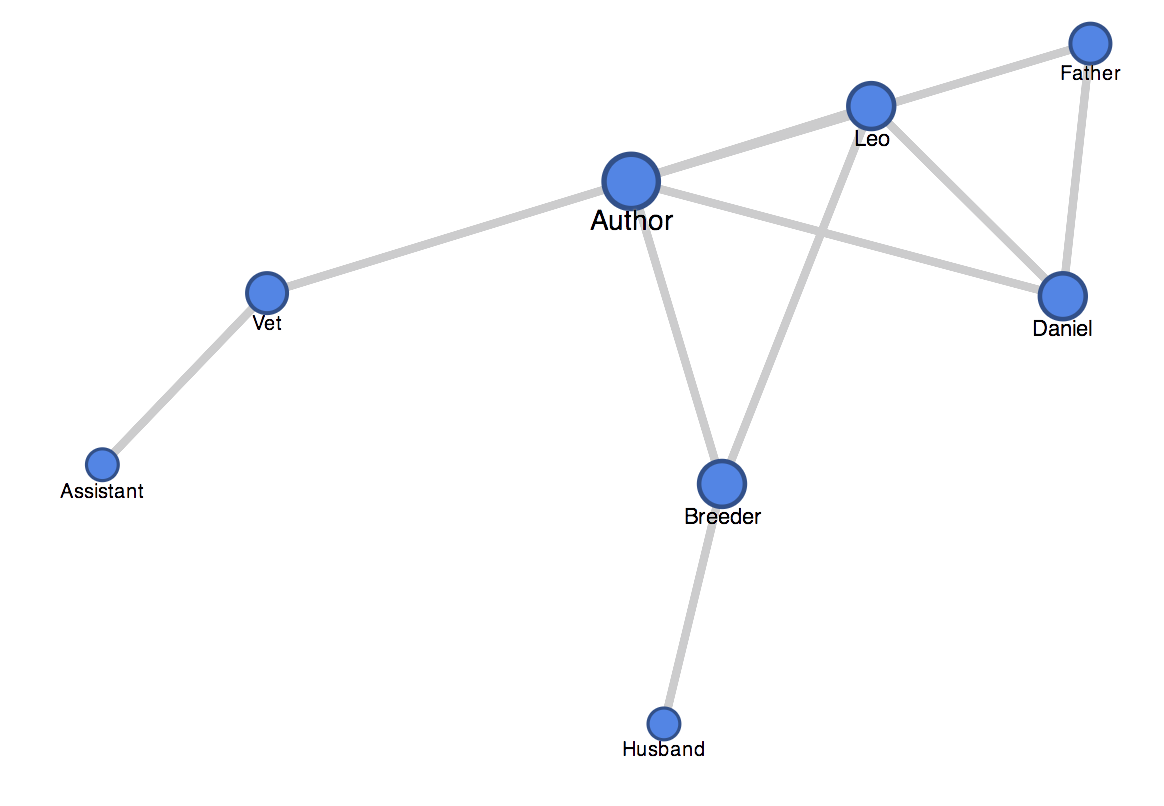
By examining this table, it gives a visual representation of how the characters are connected, in this case, if they know each other. As Rausing, the author, is the narrator of this short story, she is the central node in this table. Her son is also one of the larger more central nodes in the chart, as Rausing speaks of her family. Because there is such little information on the characters because these are from a short story, there isn’t too much of significance shown on just the table. If we had more information about the characters and added more variables and edges, we could possibly create another table or a more complex network to show the similarities and differences. This chart only shows how the characters know each other, but if we added something like the characters’ preferences or how long they’ve known each other, or even added more characters that could exist, there will be more content to analyze, thus creating more intricate edges.
Something interesting is that, like discussed in class, the fact that the central node is always the first person we speak to holds true in this network. As we see things from the author’s perspective, there are only characters the author personally know or know of. This creates unavoidable bias in the chart. This may be something to keep in mind when doing our projects for class.