This week I decided to look at the Frosted Sugar Bombs data which was basically just a list of ten thousand boxes of Frosted Sugar Bombs weight. From the data presented you can see very small differences in the weight of the boxes. However, with this scatter plot:
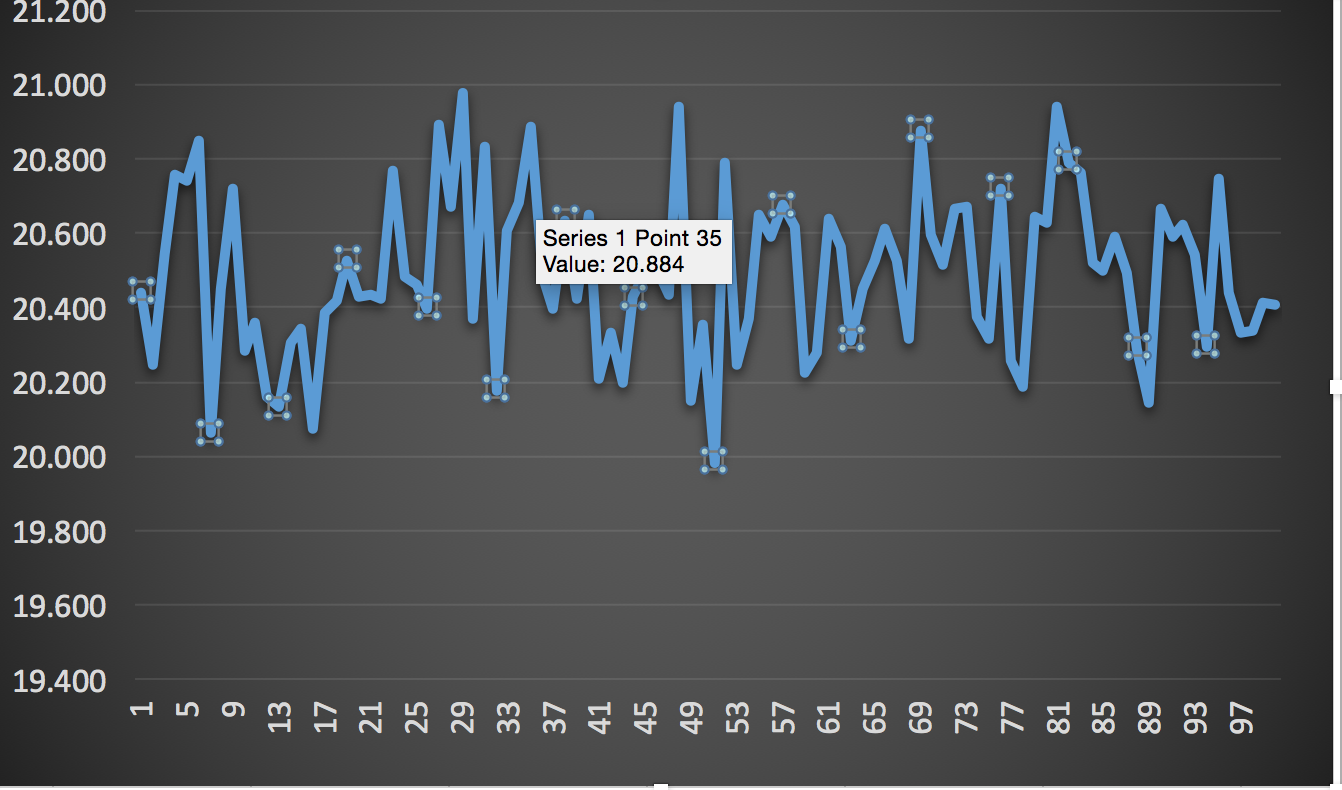
One can begin to visualize just how far apart the weights can vary. The line graph helps the reader see around where the mean exists in this data. From the data, I found that the median was 20.45 oz, 20.44 oz was the mode, and the range was 19.74 oz to 21.16 oz. This graph does not examine all the data but instead looks at 100 values of weight in order to condense the scope of the project. It is unnecessary to look at 10,000 boxes when statistically taking a smaller subset of that data would not affect finding the mean or variation substantially in your final analysis.