Although the Chocolate Frosted Sugar Bombs dataset is quite basic, I had to choose it because it relates to Calvin and Hobbes!
This dataset deals with a random sample of 1000 boxes of the fictional cereal, and their corresponding weights.
For my visualization, I used Tableau to map out the counts for each measured weight. Close data points are grouped together, so its a more cohesive histogram. In this imaginary case-study, the manufacturer is under investigation for whether the cereal boxes truly did contain over 20 ounces as advertised.
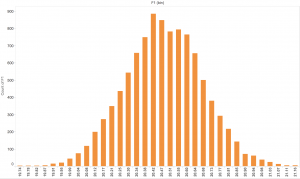
Without the actual visualization, it would be unclear whether the “General Junkfoods Corporation” really did participate in active false-advertising. There are 1000 separate records, so it’s difficult to come to a conclusion with just a glance. By using a histogram visualization on Tableau, I can see that the average weight is around 20.45oz. There are cases where the boxes fall under 20oz, but that occurs for less than 10% of the products.
It’s also interesting that the data fits an approximately normal distribution. Even for an imaginary manufacturing process, there is variation in the final products–some lucky consumers get an extra ounce of sugary goodness!
Note: Sorry for the low resolution images. The original files are higher quality, but they seem to downgrade on WordPress.