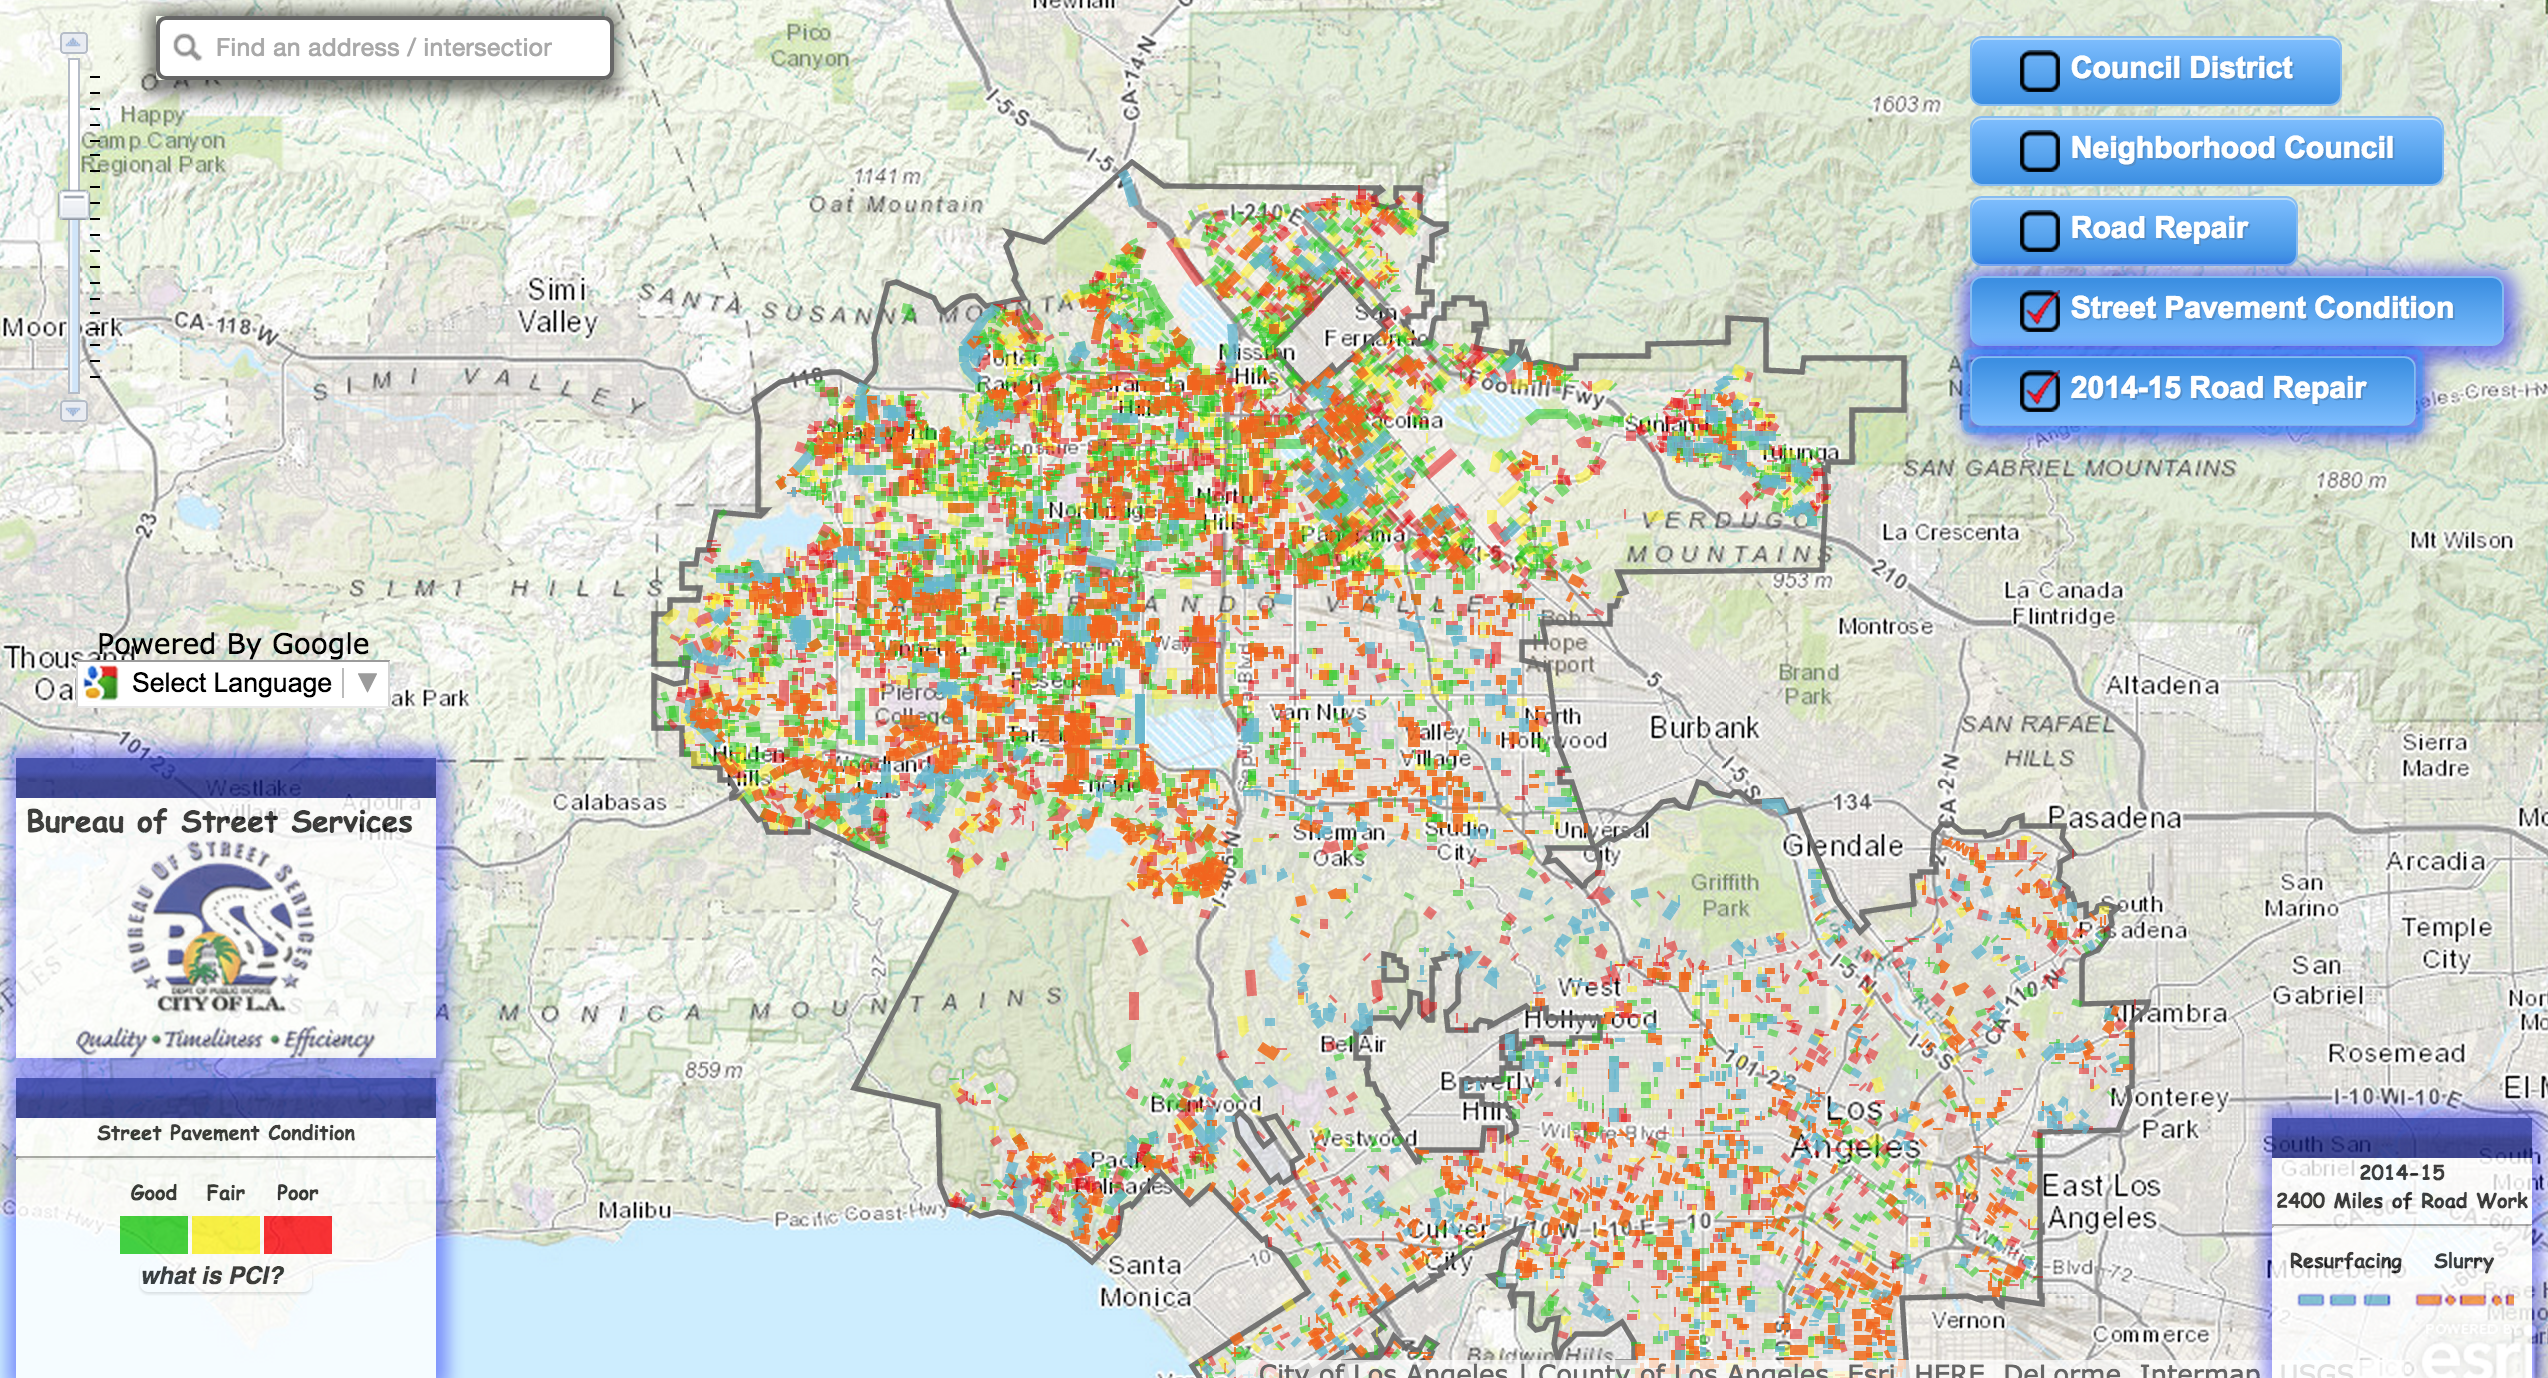
I examined the Bureau of Street Services Street Assessment Map. The dataset shows the road conditions of the city of Los Angeles in the 2014 to 2015. This data set was different from others, in the sense that it came in a physical map form instead of a spreadsheet. It is already converted into a visual piece with various colors, codes and figures to aid navigation through the dataset. Every street and location on the map is shows the level of the road conditions when hovered over, ranging from good to poor.
The data types in this dataset are: Street Pavement Condition, Road Repair Condition, Council District, and Neighborhood Council. These data types are listed as check boxes on the side to easily add or remove on the map for personalization and to look for specific ranges in data.
Ontology is defined by Wallack and Srinivasan as “systems of categories and their interrelations by which groups order and manage information about the people, places, things, and events around them.” For this dataset, the ontology is the Street Pavement Condition, ranging between good, fair, and poor, marked by red, yellow, and green. Another ontology is the work type of the ongoing work process, between resurfacing to reconstructing, marked in blue boxes across all relevant neighborhoods. All proposed projects are marked in purple boxes on the map.
This dataset is useful for city officials and policymakers, in particular those who are in charge of finances and city funds. It can show how much work needs to be done to fix these poor roads, and estimate how much money it would cost. It is clear that some neighborhoods have had more repair done than others, so one can take into consideration what locations have been or have not been serviced. From a construction and urban planning point of view, these are issues that should be fixed before anything can be built and constructed in given areas. Health and safety are things to be taken into consideration as well.
Another view for ontology is the construction side of the matter. This data set is very subjective, in the sense that it doesn’t list the criteria for “good, fair, and poor” conditions for a road. One area which is “poor” may be much better or worse than “poor” in another area. In that sense, it will be hard to know which area is more of a priority in regards to damage and costs. Perhaps something that might help is listing dates for relevance; tentative fixture dates, when the road was last serviced, etc. These are things that could help officials on the construction side, to look for trends and see what worked and what didn’t work in terms of road repair.