http://www.123dapp.com/Catch/water-bottle/4813270
Today I had a look at the LA Controller’s Office . The great thing about this site is that it is all “Open Data”– that is, data is made accessible to the public. People are able to open, download, and shared regardless of any relationship with the LA Controller’s Office.
I chose to dig into the Top Earners category, and right off the bat, I can tell that this dataset would be an interesting one, given that the first thing I saw was a massive bar chart! The purpose of one of the data types being a bar chart is to demonstrate the maximum earnings or expected earnings of government workers, and the multiple colors denote different types of payment. A legend accompanies the chart to allow for readability of the bars while scrolling downward.
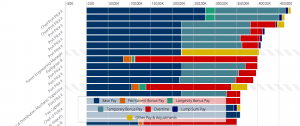
What the bar chart looks like; you can scroll down it for miles! The breakdown of the legend is: dark blue for base pay, orange for permanent bonus pay, green for longevity bonus pay, turquoise for temporary bonus pay, red for overtime, royal blue for lump sum pay, and yellow for other pay and/or adjustments.
As one can see, it’s definitely a lot to take in, but the use of the legend definitely made this dataset a little more easy to understand. Furthermore, the estimates of pay constitute as records within this dataset; data has been arranged and categorized accordingly, such as the payment that applies to pilots, but taken farther by description such as “chief port pilots” and just “port pilots.” Interestingly, chief port pilots make the most pay out of all government jobs; their base pay alone is about $277,000! Another reason why this is a record is that the data set is supposedly counting yearly payment, so information had been researched and noted over a course of time; in this case, from the years of 2011 to 2014.
The dataset’s ontology is similar to what Wallack and Srinivasan described as “a descriptive and classifying system” which negotiate the limitations of two or more groups. The dataset is certainly structured in a sense that allows for any sort of information to be arranged so that it is more user-friendly. The application of a bar chart only highlights the link between each group, such as the types of pay, with the type of job, falling under a total pay amount for the year. I would say that many people would find this data most useful; however, this will absolutely come in handy for those trying to research the city’s top earners and why. Why is it that the top earner is a chief port pilot versus a firefighter? Could it be the different training needed, or employment rates for each job? Such questions like these can be something one may ask when looking for answers using this dataset. It also tells the phenomena of how a job market in a specific area is subject to change over the years. Looking at this dataset, one can tell the demand for a category from another just by pay alone.
What gets left out, however, are additional information that may be even more useful such as how the pay is for part time, or the amount of people they surveyed for one category. Why certain jobs are paid more in bonuses or base pay is also up for question.
If i was starting over with data-collection, I would want to do somewhat of the same ontology that this set has used; charts are just so great in how it visualizes data and maintains organization of it! But I will say that if I were someone else, I would probably look for another way to display the dataset, like a map of where different workers are located that might explain a difference in types of pay, or a little description beside each job that explains what they do. In general, however, the Top Earners dataset on the LA Controller’s Office site is well put together and thought out, and it’s nice to see that a set like this is available for public use.
The UCLA Preserved Silent Animation library houses a collection of 11 silent animation films that are extremely rare to find or access online. These films stemming from the early 1930’s animation “Golden Era” are described as survivors of their time; many of the films in this project had been painstakingly recovered from neglect, mishandling, vault fires, and nitrate decomposition. The collection’s purpose is to showcase many forms of animation spanning the silent film era, using an archival website designed as a sort of play-reel that filters through all 11 silent works on a screen made to look like a theater.
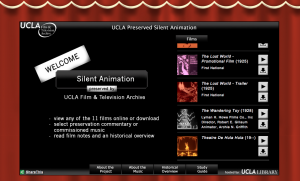
The layout of the website, with links below about the project and a slideshow-like sidebar with all the films.
The way the films are set up to be displayed on the site works in exhibiting the variety of the collection’s nature; all are animated yet can be seen to clearly have different art styles and animation and filming methods, just through the thumbnails alone. The title, creator(s), and year of release of each film appears above the respective thumbnails; I would say that this is an unconventional way to organize content, but it nonetheless works for a medium such as film. Users are also not only allowed to view the 11 films in their entirety, but may also download select preservation commentary or commissioned music, as well as read preservationist and historian notes for each one. One can also select which version(s) to play: whether the silent film by itself or with the music scores or preservationist commentaries layered over it.

How it looks when you view a film; users can check more than one box to hear piano accompaniments, music scores, and preservationist commentaries.
The films themselves serve to demonstrate different depictions of life as it may have been during the Golden Era of the United States. Comparing the very first and earliest film, The Enchanted Drawing, to the last, Theatre De Hula Hula, users can see how much society had progressed culturally and historically through viewing one after another. Mixed into each work are hints of comedy, drama, romance, and pure fun; the essence of animated works at that time allow rather sensitive or deeper topics to be expressed through a lighter, more engaging art form during the silent era. If I were to write a paper based on this archive, I would be able to tell how the impact of these films still pose in history as extraordinary pieces from a time of artistic revival. If any one or all of these 11 films had been lost, we may very well have never known what the extent of silent animation was, how the majority of silent animation films are often unknowingly destroyed, and why it is necessary to pursue even more preservation efforts for silent animation works.
What I was not able to tell based on this archive, however, was the individual significances of these 11 films; out of all the silent films to exist, why are these the only ones that is archived in the UCLA silent animation library? Surely, if a brief description was included stating why preservationists and historians decided to archive these select films, it would help in comprehending their importance in a wider perspective. To remedy this, I would (and I did for some, just out of curiosity) have to further research each of the 11 films and find out their plot lines and characters, the method of animation and film used, who their creators were, and their final product as a film and relate them back to the social and cultural climates they emerged from. Even better, if there were an easily accessible outside archive of all silent animated films that would make extra researching more convenient. From there, it would be more clear to understand the value of this archive in terms of a broad American history, as well.
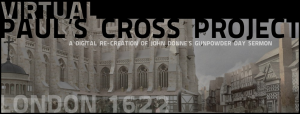
Recently, I had the pleasure of taking a look at the Virtual Paul’s Cross Project, a project that enables users to experience the delivery of John Donne’s sermon for Gunpowder Day as it may have been in early 1600’s London. Not only did this project attempt to recreate this speech through an audio medium, but it also provided the exact information of where the sermon took place through digital layouts, what the setting looked like with a visual model, the acoustics of the building structure, the occasion, a typed script of the speech, and who the speaker was. This project definitely delivered itself as a well-packaged database full of material for a user to interact with; however, there are some downfalls that I had noticed that, although minor, still highlights just how complex and difficult it is to compile and execute a digital humanities project such as this one.
Category. I would identify this project as a history-based one. Already from the title of the project, the website’s introduction page contains the event’s date, signifying that this particular date is notable in human history (or, more particularly, British history). On the Purpose page, the creators of this project state that Virtual Paul’s Cross Project, “helps us to explore public preaching in early modern London, enabling us to experience a Paul’s Cross sermon as a performance, as an event unfolding in real time in the context of an interactive and collaborative occasion.”
THE BLACK BOX: Sources, Processes and Presented
Sources. Poking around the whole site, we can see three distinct layers that truly make up this project. In terms of sources, the most distinct source that was supplied was the manuscript of the sermon– a high resolution image of it, actually. Clicking the Sermon page takes you to a page with the image of the script. If you go on the The Script page, a full translation of the manuscript is given along with the times certain parts of it were given. Clicking on the other pages on the main bar also provided sources such as a model of the overhead view of the setting where the sermon took place, audio recordings of an actor preaching the sermon, and other digital renderings of the building, weather, and crowd size. To add onto the sources coming from this project, the creators have the Works Cited and Links pages which lists every primary and secondary source they had gotten information from, listed under Support.
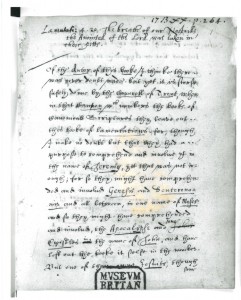
The image of the sermon manuscript as seen on the Sermon page.
Processes. Categorizing the processes in this project were pretty straightforward– I think Virtual Paul’s Cross Project did a great job in contributing a wide variety of services for users to access on each page. There were enhanced images for the script, 3D visualizations (which possibly employed the use of SketchUp) with zoom and turn features for the setting, audio recordings for the sermon, and digitally rendered flat layout designs for the acoustics and structural aspects of the building this all took place in.
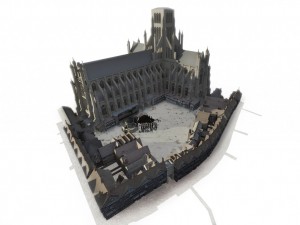
The overview model of Paul’s Churchyard, found on the Churchyard page.
Presented. This project surely succeeded in trying to give as much information as possible to allow a great virtual experience. All the sources and processes were displayed on this website through the employment of 3D modeling and mapping, which complemented the audio recreation of the sermon which users may listen to as they browse the encyclopedia-esque site. Every page allowed viewable access and was simple enough to maneuver around, yet encompassed a great deal of material.
Setbacks. I did dislike how it seemed nearly impossible to find out what this event meant in context to world history; maybe it’s because I’m an American, but I don’t know what the Paul’s Cross Sermon(s) were, and what they really did to begin, change, or improve public preaching.
All in all, I can see that even with some minor faults this digital humanities project is extensive and extremely valuable to many users, and the completed product is certainly deserving of recognition not only in fields of history, but possibly in other humanities studies.
© 2026 DH101
Theme by Anders Noren — Up ↑