DH101

Introduction to Digital Humanities

Page 16 of 38

The Man at the River Network Graph

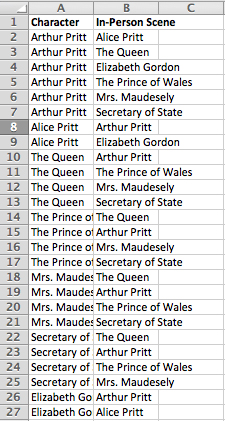
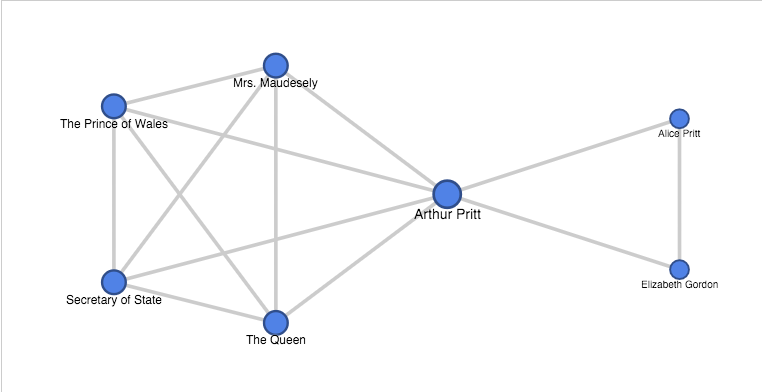
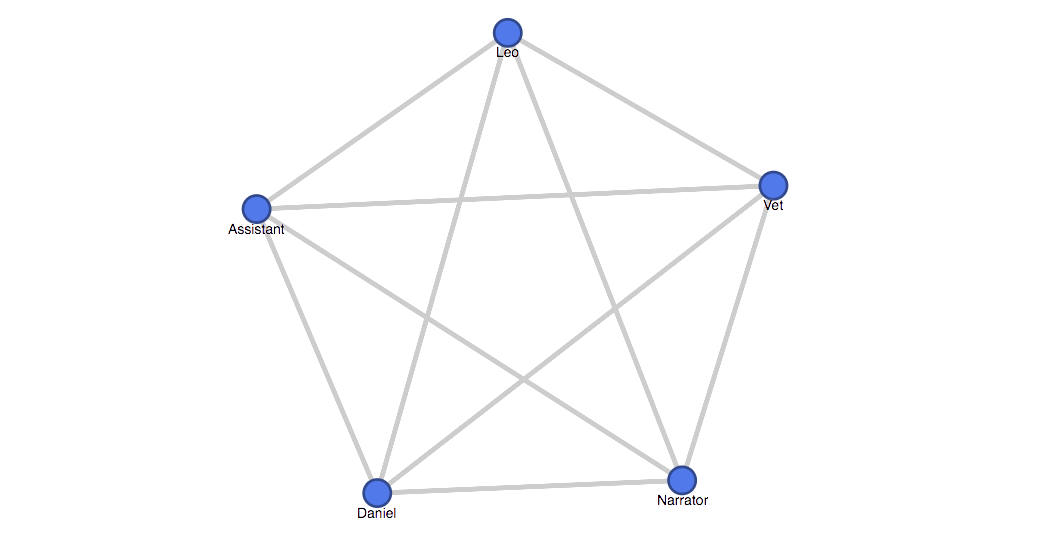
I read the short story “The Man at the River” by Dave Eggers, from the Granta Travel edition. The story is narrated in 3rd person and focuses on an American Man who bikes with his Sudanese friend to a river in Sudan. At the River the American decides not to cross for fear of getting an infection from the water, while the Sudanese Man crosses. A friend of the Sudanese Man (Fecond Friend) comes to the river prompted by the Sudanese Man to get the American Man to cross the river. After a long conversation the second friend enlists the help of a Fisherman on the river to use his canoe to help the American Man to cross. This is the network graph I created using google fusion tables:

Screen Shot 2015-11-09 at 12.08.40 AM

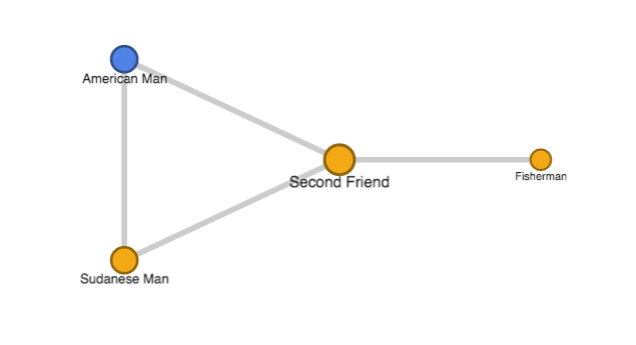
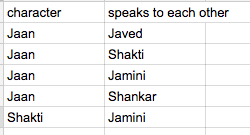
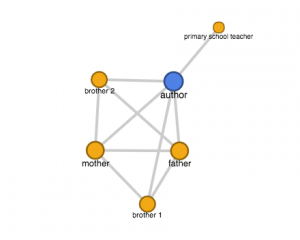
I took the names for each of the nodes from the character names from in the story.  The edges between each character are defined by who speaks to one another in the story. The most central node is the Second Friend because he has the most in-degree and out-degree connections, because he speaks to every character in the story. The colors of the nodes indicate nationality: Blue = American and Yellow = Sudanese. I added the color coding to the nodes because nationality plays a big role in the relationships between each of the characters.

Although there are only four characters in this short story, I thought this would be an interesting story to create a network graph for because through this story one can analyze the limitations of network graphs. Each character in the story has a very complex relationship with one another, that is influenced by cultural, linguistic, and political factors that are hard to convey through a network graph. I chose to define the edges in the network graph by which characters have conversations, because the conversations are a critical part of the story. However, I think in order to more fully understand the nature of the relationships in this story one would have to create multiple network graphs, or multiple edges between nodes that illustrate different types of connections. Even still there would be aspects of characters’ relationships that would be hard to convey through a network graph. For example, in this story there is a relationship between the Fisherman and the American Man because the Fisherman takes the American Man across the river in his own canoe, while he wades across the river in the water. This exchange between the two of them during the crossing that cannot easily be illustrated on network graph showing all four characters, because they do not speak to one another, nor do they know one another.  And if it could be shown the cultural, linguistic, and political factors that influence and frame their exchange could not be illustrated on the graph.

Network Analysis: Scandalous Jubilee Stories

“Jubilee,” a short story written by Carys Davies published in Granta 119: Britain Online Fiction, is a poignant tale that is set at (what is supposed to be) a joyous and special celebration attended by British royalty.  The story begins with the thoughts of Arthur Pritt, an alderman, who feels sorry for Her Majesty The Queen because of the tediousness of the day. He notes that she looks bored and miserable and he wishes that the jubilee celebration had something different and more interesting than the usual proceedings, such as fireworks, acrobats, or magicians. These present thoughts are intertwined with sad memories from Arthur’s personal life with Alice, his ex-wife. Eventually, Arthur whispers in The Queen’s ear his name and the fact that he is sorry for the boring day and what she has to sit through. The Queen reacts by asking Arthur to tell her a story, at the dismay of the Prince of Wales who she waves to halt his protest as he wants The Queen to pay attention. Arthur continues to tell The Queen a story about his personal life, in which he caught his wife in bed with her piano teacher-turned-lover, Elizabeth Gordon. The Queen is enthralled by the story, reacts accordingly, and then goes back about her business. Arthur goes back to his empty house.

I made an edge list of explicit characters in the story (whose name and/or title was explicitly mentioned in the story) and defined a connection as who they had had in-person scenes/interactions with. Below is a screenshot of my edge list in Excel.
Screen Shot 2015-11-08 at 11.52.43 PM

I saved that Excel document as a CSV and uploaded it into Google Fusion Tables to create the network char. Here is my network graph of “Jubilee.” Below is a screenshot, as I couldn’t figure out how to embed the interactive graph itself (only the html code would show up).

Screen Shot 2015-11-08 at 11.51.35 PM


This network graph illuminates which characters had direct connections with each other. It shows that Arthur Pritt was the central connector within this short story, as he bridged individuals of his personal life with those on-scene at the Jubilee. However, the graph does not tell you the nature of these relationships between characters. It doesn’t tell youIt does not tell you how Arthur bridged the two worlds together–by telling the personal anecdote of his unfortunate misgivings to the Queen at the celebration. The chart lacks the size of role each character played in the story, as The Queen played a more central role but whose node is the same size as the minor characters of Mrs. Maudesely and the Prince of Wales who didn’t have any dialogue in the piece. The most difficult part of creating this graph was choosing how to define the connections between the nodes. I feel like I could have found a different method of categorization/connection that might have allowed for a different network graph that made more sense and was more illuminating.


Network Graph “Sisters”

I created a very simple network graph from the characters in the short story “Sisters” by Anjum Hasan. In the story Jaan hires a maid, Jamini, who she becomes very close to.  Jamini then dies and Jaan goes to the slums to try to figure out how and why. The nodes where the five characters in the stories that had names and dialogue. Their edges where if they talked to one another during the course of the story.


Screen Shot 2015-11-08 at 11.11.47 PM

My network graph illuminates that Jaan is the central character in the story because she is the only one who conversed with everyone else. She has the highest degree of 4. Shakti and Jamini seem to be the second most connected character with the degree of 2. Without creating a network graph and analyzing the text without digital tools, I would agree that Jaan is the main character, but I would not agree that Shakti and Jamini are tied for second most important. Because this network is so simple, there are many limitations.

Screen Shot 2015-11-08 at 11.26.54 PM

For example, I only included dialogue that existed in the story. Shankar is the son of Jamini so it can be assumed that they spoke to each other, although a scene did not exist within the confines of this story. The same can be said with Jamini and her boss’s (Jaan) husband, Javed. These characters knew each other and probably spoke, but the network graph only shows dialogue between characters in the story. If it showed relation perhaps, Jamini would seem as central of a character as Jaan.

I also could of added in secondary edges, like friendly interactions and unfriendly interactions. I could compare this with which characters who spoke to each other and see if characters that had friendly interactions also spoke to more people.

I could of also coded for more characters that were not named and did not have dialogue, such as the baby or the group of slum women. This could of shown more of the division of classes based off of the smaller compounds within a larger network.

Overall it is obvious to me that network graphs can act as a close reading for text. Even with a simple list of characters that spoke to each other acted as a piece of evidence for something that I thought was true just through reading. With more elaborate graphs I’d expect not only confirmation to what I already thought was true but also revealing new information that I had not considered before.

Callan Wink’s “Exotics”

In Callan Wink’s Exotics, the reader is introduced to the protagonist, James Colson, who is a school teacher at Pine Creek School. The short story begins with James ending the school year and beginning his summer vacation. We learn that James is extremely unhappy being a teacher and is quite impulsive when he decides to leave for the summer to get away. Because James is traveling throughout this short story, I decided to group the character’s relationships by setting.

In the story, we see that James lives in Montana where his strongest relationship is with his lover, Carina. There is a mentioning of two other students: Molly Hatchet and Ellen Realbird as well as a Montana State Guest Speaker. Then James travels to Colorado to visit his brother, Casey and Casey’s wife, Linda. Then eventually we see James travel to work in a ranch in Austin with a man named Karl.

Even though the Network Analysis helped to group these characters and give some meaning behind the basis of James’ and their relationships, I feel that GoogleFusions did not fully encapsulate what I wanted. I wanted to represent how important they were to James, but I struggled with finding a way to depict that. Even though Carina is the character who he has the strongest bond with, she is only seen in the first part of the short story then remembered throughout. I wasn’t sure how to accurately group these characters to fully depict their relationships to James.

Also, half of the characters mentioned in the short story played very slim roles in the plot and had such a loose relationship with James that it was hard to decide whether they were important enough to be in the chart. However, without them only four characters would have been in the GoogleFusion tables, so all were included.

Screen Shot 2015-11-08 at 11.06.29 PM

Network Analysis

Screen Shot 2015-11-08 at 오후 10.31.27

I created a network graph representing the connection between the characters in Mia Couto’s “When Did I Become a Writer?” The story is about specific moments in Couto’s life that led her to “become” a writer. She believes that one never “becomes” a writer; either one is a writer or isn’t. But if she has to answer the question,”When did you become a writer?” which people frequently ask her, in hindsight, it wouldn’t be one single moment but multiple – when she saw a lion for the first time, whenever she listened to the stories her immigrant parents told about their younger less fortunate days and when she heard her preschool teacher read aloud a story about his mother. Looking back, even as a child, Couto was captivated by the power of stories to reveal and emotionally evoke.

The nodes in the graph represent the characters and the edges represent the moments they were in the same scene.  In other words, one of the columns was attributed to characters and the other to the characters each in the first column shared a scene with.

Although the graph is a fairly simple one with only six nodes in total, it illustrates the big presence of the author’s family in her life as a writer; she is in the same scene with every single family member of hers. And every scene that they are in includes the author. They do not share a moment of exclusivity which goes to show that the story is parochial in perspective, focusing entirely on moments where Couto is the main character of a scenario. Couto’s primary school teacher is the only person outside the family she shares a scene with, and given that he never encounters the other characters but Couto, the relationships between the characters in this story are far from interconnected. The story is told from the perspective of Couto, so it makes sense that Couto is the center holding the graph together.

The network graph fails to paint a picture of the type of relationship each character has with another. Whether it’s a positive or negative one, we are not sure. And it’s hard to tell how each character played a role in motivating Couto to become a writer – the central theme of the story.

Introduction: Posession

This week, I read Introduction: Possession which is a story about a royal family, specifically the queen, who discovers the amount of passion involved in life and death. The most important aspect for the narrator is how she discovers the amount of passion that she had for the dog, Leo. She discovers her passion has no limits in life and death.


I created a network graph which shows how connected all the characters in this short story were, depicted below.

Screen Shot 2015-11-08 at 9.37.34 PM

https://www.google.com/fusiontables/DataSource?docid=1sPkzY69xHmuv46pbGDBLer6vfoAYhPMr6WQ8z3fI


The graph shows how the dying dog brought together both family and non-family because of the connection with all of the members involved wanting to save the dog.  This illustrates the story’s underlying theme of passion with regards to love and death. Unfortunately, the graph doesn’t show any specific relations with the characters of the story. So, for example, the graph does not show that Daniel is the son of the Narrator.


These types of networking graphs are very useful for many things including understanding complicated story plots. One instance where I think this type of graph would be extremely useful is in Shakespeare’s plays such as Hamlet or MacBeth where character relations can become confusing.

Quarter Past Midnight

In “Quarter Past Midnight” by Marie-Helene Bertino, Ben Allen takes Sarina Greene as his prom date to their high school prom, but the night ends differently than they both wished for. Ben wants to look cool in front of his date, so, under the wrong advice, he limits compliments and interactions with Sarina throughout the night. He leaves her alone and hangs out with another girl. And this only leads to heartbreak and misunderstanding between Ben and Sarina. Sarina, whose father left her family not too long ago, thought prom would be the only thing that can make her life more bearable. However, her date not only neglects her but she witnesses him kissing another girl. Ben doesn’t notice Sarina’s disappointment until he sees her dancing with another classmate.

The characters are connected through their interactions with each other. I chose to include both spoken interactions and implicit interactions since some characters appear together in a scene without any dialogues exchanged with each other.

Screen Shot 2015-11-08 at 9.51.46 PM

We can see from the graph that there are four characters that stand out in regards to the number of connections, or a lack thereof: Tom’s date, Jeff Allen, Michael Lawrence, and the theatre girl. And within the context of the story, problems arise either directly or indirectly due to these characters. For example, Jeff Allen was the source of Ben’s misinformation regarding how to behave around a girl. And Ben’s act of kindness towards an upset girl led her to kiss him without notice, which was seen by Sarina. Then, we can somewhat deduce that the characters outside of the normal sphere of connections between friends and family may play a role in bringing instability and confusion between characters. We can also see that Sarina and Ben are the most central characters based on the number of common connections shared with each other, but Ben has more extraneous connections.

However, it is hard to see what kind of interactions or relationships the characters had with each other. The network graph is a very limited representation of the characters’ connections, and it reveals no information about the quality of the connections or its significance. We can wrongly assume that Sarina was a part of Ben’s social circle previous to the prom night or that Ben is well acquainted with Michael Lawrence. We can possibly weigh the connections, but the nature of the story does not provide enough information to incorporate weight into network graph. Therefore, the graph can be helpful in understanding some of the connections between characters in relation to events, but it can also be deceiving.

Week 7 Blogpost

Screen Shot 2015-11-08 at 6.18.18 PM

I chose to create a network graph of “Her Lousy Shoes” by Tracy O’Neill. The narrator, William Douglas, describes his unhappy marriage to his wife, Miranda Shelby. William, a professor, recounts his experiences around the holidays and his general discontentment with his life. The entire short story is told from William’s perspective. The reader understands all of William’s inner thoughts and the nature of his relationships, through his interpretation.

Since the perspective is third person limited, the reader contextualizes all of the relationships around William. We do not get any insight into the interactions or relationships between the other characters. In this short story, there is mention of William’s sister and Miranda having a close relationship. However, since William narrates the story, the reader is not made aware of the nature of this relationship.

In my network graph, the edges represent conversations between characters. The narrator, William Douglas, speaks with a handful of characters throughout the story. However, he does not recount any conversations that other characters had that he was not included in. Therefore, William is the most connected character in this network graph. He has a high degree of centrality as well as a high betweenness centrality. He connects the most number of people to each other. William also has a high closeness centrality, since he’s connected with the most number of people, he can communicate quickly to all of them.

The edges represent any two characters that have spoken to each other. They are non-directional. This is a large reason why the network graph is so small and centered around William. Since the narrative is told in third person limited, it is mostly William who converses with all of the other characters. This factor not only skews the network graph, but also the reader’s perception of the other characters. It appears that William is the link between everyone, when in fact, it only seems this way because his conversations are the only ones documented in the story.

The perspective is a large limitation on the network graph. It radically changes the reader’s interpretation of William as a character. If a person were to view only this network graph and not read the story, they would assume that William is a highly social character who interacts with lots of people. However, this is not necessarily true. From the characterization of William in the short story, he is relatively introverted and does not interact with many people, unless he is forced to. In this way, the network graph provides an inaccurate representation of the short story.

It is interesting to see how different one can perceive a character when viewing a network graph versus reading a short story about the same character. The network graph is often very reductive and does not provide an accurate representation of the characters and their relationships.

I Like Being a Woman (And I Hate Hysterical Women): A Network Graph

The short story, “I Like Being a Woman (And I Hate Hysterical Women)” by Leila Guerriero is a partly introspective and recounting narrative that explores underlying themes of feminism, shame, obligation, and self-identity that plagues women around the world. Leila’s interpretation stems from descriptive encounters with family members, friends, strangers, and her husband as her life progresses. Each paragraph contains an instance with another person, fitting for a network graph. Interestingly, however, the process of creating the graph and analyzing the relationships between Leila and others proved to be more informational than originally imagined, and with this short story I found myself appreciating the art of writing and the deeply relative and personal connections it can mirror onto readers.

I first started my analysis by creating a Google sheet to track the characters’ interactions by name and scene. For example, I have Leila’s name in one column, and a character she interacted with in a scene on the next column. I repeated her name in the first column while adding names onto the second one as the story carried on. In one scene, both Leila and a classmate, Paola, encounter two characters at the same time. Thus, I put Paola’s name in the first column after Leila’s, and repeated the characters they interacted with in the second column accordingly.

Screen Shot 2015-11-08 at 7.33.21 PM

Once I finished the sheet, I exported it as a .csv and uploaded it to Google Fusion Tables. Finally, I created a chart with my data. I found the above graph to fit best, as it demonstrates how Leila is the main character and narrator. It also shows how connected she is to all of the people mentioned; yet at the same time, the others are not connected to each other. From further analysis, one can come to the sense that this is perhaps what the writer wanted to illustrate to readers– with Leila being both an un-proclaimed feminist and a soft-spoken, inquisitive individual, it better portrays the double standards applied to women. The lack of connection between the other characters aside from Leila also may bring about the absence of direction for Leila to follow, thus highlighting how contradictory it is to be a women in a world dominated by contempt, masculine influence, and the abasement of both sexual and physical freedom.

Screen Shot 2015-11-08 at 7.45.44 PM

All in all, having a network graph to accompany a short story has allowed me to better understand the broader applicability of the themes present, has given me great achievement in exploring what it means to be a universal learner, and engage humanities material through employment and experimentation with digital tools.

*on a sidenote: I’m not sure how to embed the chart. I tried putting the embed code onto this post but it only displays the code. Maybe I’m not using the right code or placement?”


The Intoxicated Years

by Mariana Enriquez

This piece by Mariana Enriquez illustrates the journey of three best friends and their relationship with drugs in a struggling country near Buenos Aires. The poor state of the country reflects through the actions of the girls as they find ways to enjoy life.

I created a network graph that linked the characters with drug scenes in the story.

the intoxicated work

The graph clearly shows that Andrea, Paula, and Me are close with each other as they are connected with most of the edges. Andrea is connected to a few additional edges that Paula and Me aren’t. This highlights that Paula and Me are closer.

The network doesn’t show whether or not the characters used the drugs. For example, Andrea’s first boyfriend did not use drugs but he was there while the main characters were using them.

« Older posts Newer posts »

© 2026 DH101

Theme by Anders NorenUp ↑