For this assignment I looked at the LA County Controller’s Office Payroll Top Earners is a dataset which shows a chart of LA city workers’ occupations and salaries recorded in 2014.
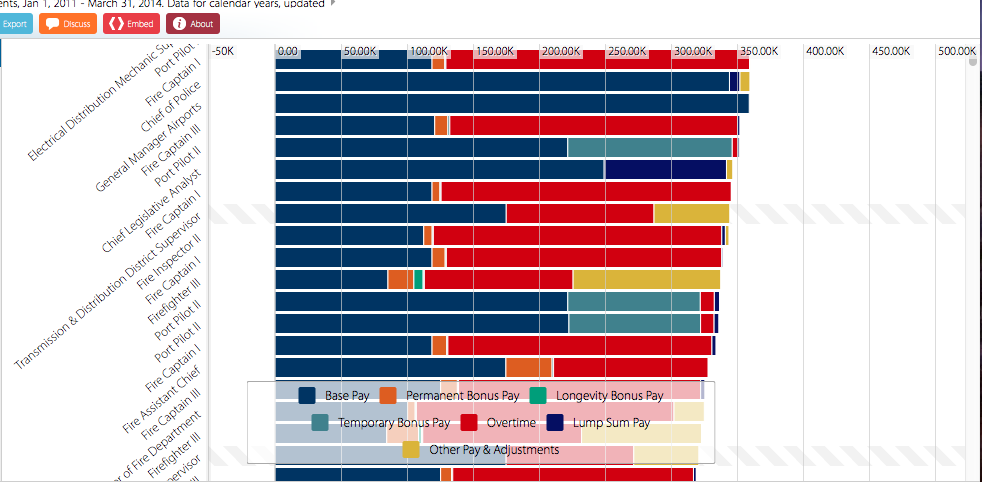
The bar chart shows the base salaries of occupations in which you work for the city of Los Angeles in dark blue. The graph also includes permanent bonus pay, longevity bonus pay, temporary bonus pay, overtime, lump sum pay, as well as other pay & adjustments in various colors to distinguish them from each other. You can stroll down through the vast number of top earning positions employed by the city, which was pretty eye-opening for me since I was unaware that a lot of the jobs even existed let alone their earning potential. The site offers different search features in order to filter through the expansive chart which is organized with the highest possible earning value at the top and lowest at the bottom.
If according to Wallack and Srinivasan ontologies are the “systems of categories and their interrelations by which groups order and manage information about the people, places, things, and events around them” then the information here is ordered by the position and it’s ultimate earning value for the year of 2014. The graph would be probably the most useful to prospective city employees looking for the possible earning potential or city employees seeking more information on promotion pay as well as bonus pay in the future. The ability to filter through based on department is especially useful to job seekers since it allows them to focus solely on the department where there interests are.
The dataset definitely openly informs the public of the top earning salaries for various jobs employed by the city of Los Angeles. The graph fails to provide more of what you might refer to as contextual information concerning the positions. For example, though overtime is one of the color-coded categories on a graph, we are left uniformed concerning the amount of hours in each work day for each position. Users are also left without the job description of each position which is some cases most likely unnecessary like with firefighters, but with even the highest earning position, Chief Port Pilot II, it’s unclear what the job involves on a day to day basis meriting such high earnings or if it even does merit the earnings, though that might be more of a subjective interpretation. The chart also leaves out the cost of living in LA which would contribute to what some might consider inflated salaries.
If I were starting over with data collection I might look more at the employed individuals as well as their salary. I might also try to gage the community value for each position in relation to the amount they earn to search for any discrepancies and possible instances of overpay.