The L.A. Controller’s Office provides data for the big purchases made by the city on its What We Buy data cards. The data shows 15 items that city spends the most money on in descending order, staring with a twin-turbine helicopter that cost $12.3 million, down to $129,218 spent on frozen rats for reptiles at the L.A. Zoo.
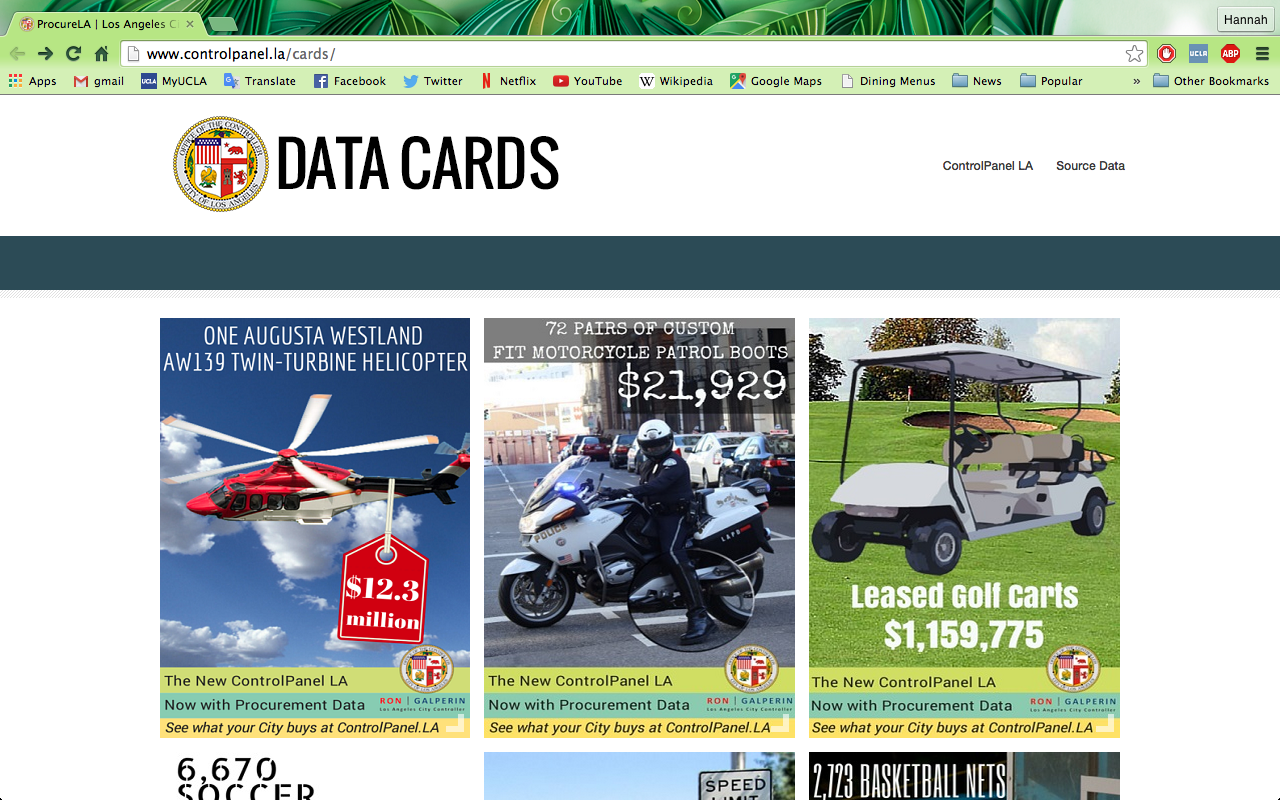
Clicking on a card provides more information – data on what the items are, why the city buys them, and a “Did you know” section for relevant facts. From these cards, you learn that the data was collected from July 1, 2011 to June 30, 2014. This was especially helpful for something like the L.U.S.T. tax, where it is not common knowledge what the category is or why spending money on it would be necessary.
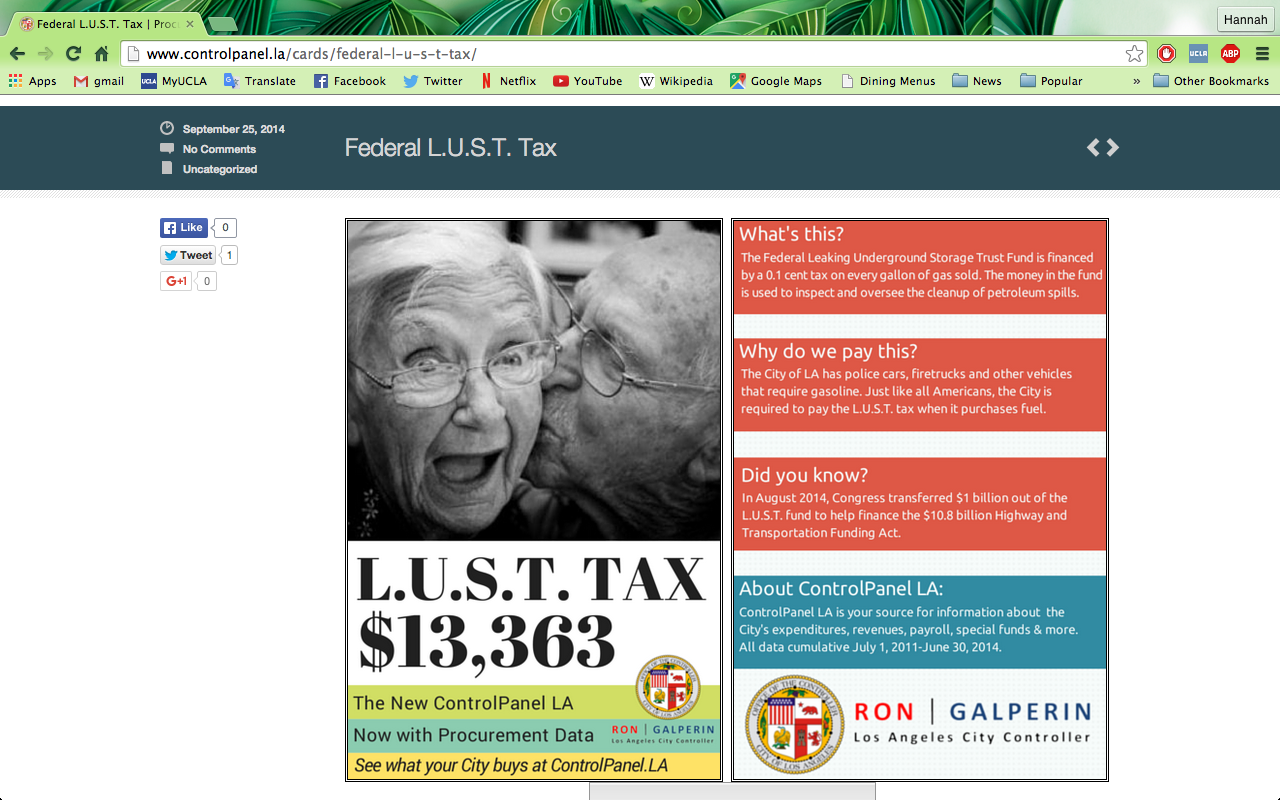
Wallack and Srinivasan define ontology as categories that groups, like a local community or a state government, use to manage and sort all of the information around them. This website uses an ontology on the front of its cards that is mostly understandable to English-speaking members of the L.A. community. Some of the categories, like thermoplastic paint or the L.U.S.T. tax that I mentioned earlier, would only be understandable to someone on the government side rather than the community side, but the details on the cards ensure that the category has an ontology that is more familiar and colloquial. Clearly, the city wants this to be understandable for its community members.
This data would be useful for anyone looking for a general overview of the city’s purchases, and its lack of detail suggests that it is for anyone in the general public who is curious. If you were looking to do an in-depth survey of how the city spends its money, you would probably need more information.
I think the biggest thing this dataset leaves out is information about the timespan. Though it says the data was collected in between 2011 and 2014, it doesn’t give the specific year that a single purchase, like the helicopter, was bought, and something like the six million ballots the city buys would have seasonal spikes, rather than continual purchases. It isn’t clear if the city bought 100 radar speed signs at once, or if they were purchased gradually over three years. For a dataset directed at the L.A. community, I think it also leaves out the city’s large population of people that don’t speak English.
If I was starting over, I could redo this dataset for an expert’s ontology who was looking for detailed information about L.A.’s spending. I might use graphs and charts to show spikes in purchasing and I would leave out the background information that an expert would already know.