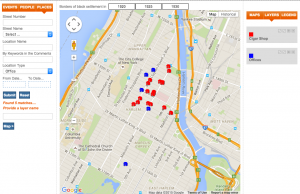
The “Digital Harlem” mapping project aims to illustrate everyday life in Harlem from 1925-1930. To construct the map information was compiled from various sources including “legal records, newspapers and other archival and published sources.” The map is interactive and allows the viewer to view featured maps or search for specific events, people or places, as well as create multiple layers on the map based upon what the viewer is searching for or interested in. A legend is provided to show what each symbol on the map signifies; clicking on symbols also brings up a window which provides more information about the item selected.
The Map certainly can reveal many things and can be used to draw comparisons based upon what the viewer is interested in looking at. For example, I added the layers “Cigar Shops” and “Offices” to see if there was a correlation between these two types of buildings. Having the ability to manipulate and engage with the map makes it more efficacious for a variety of users and scholarship. However, i think the map is more useful for people familiar with the history of Harlem, as it easier to search for a specific person, place, or event, that it is to browse these topics more broadly.
Although this project states that it aims to present the everyday life of Harlem during 1925-1930 period, it seems to focus mostly on crimes committed in Harlem and legal records. The map aimed to use legal records to show activities labeled as criminal, such as “streetlife, black language, music, family life.” However, the legal and criminal records at this time all come from a specific Western political economy that endorsed racial segregation and white supremacy. Thus what can be illuminated about Harlem everyday life through these records must be considered through thinking about how the records and data were collected given the history of the United States and this political economy.
If I were to reimagine this map, I would construct the map primarily utilizing sources such as oral histories, interviews, newspapers, artworks created by people living and working in harlem between 1925-1930. I would maintain the interactive nature of the map because I believe being able to engage with the map on multiple levels is very beneficial for research purposes and gaining more in-depth understandings.