I happened to work together with a classmate on a story that was so convoluted that we needed each other’s help. We chose to read The Girls Resembled Each Other in the Unfathomable. It was very difficult to keep track of the characters and how they related to each other. What made it more difficult was that some names were in a state of question as to whether they referred to the same person or not. My classmate and I followed a prior article analyzing Shakespearean literature and building a bimodal network chart connecting characters that appeared in the same scene. This approach seemed sensible and a good place to start.
We used Microsoft Excel to organize our data. My classmate thought of having two columns, “characters” and the character that “appears in a scene with.” This resulted in having the same character listed multiple times in each column. This provided us with a network chart showing who is connected to whom. My classmate then took that and made further interpretations on that chart. However, I wanted to take it in a different direction.
For my network chart I added two more dimensions and then collapsed them into a bimodal network. In addition to having the number of times a character appeared with another one, I wanted to give some weight to the type of relationship between them, and also make sure that we captured a known familial relationship even thought the two characters did not appear in the same scene. I gave each dimension the following weights. If two characters appeared in a scene only once, I listed them once. If two characters had a familial relationship I listed them an additional 3 times. If they were just acquainted or business associates, I listed then an additional 2 times. This provided weight and strengths to the relationships.
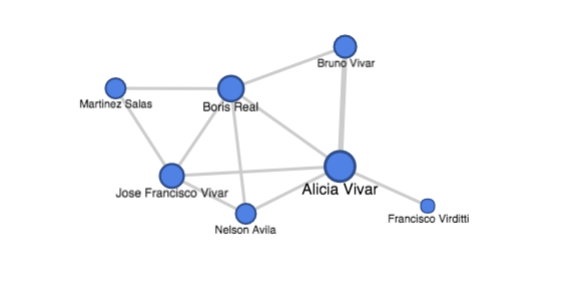
What this translated to in my network chart was that each character was an node and the edge represented the strength of their relationship. The only non pivotal node in this network analysis is Martinez Salas to Alicia Avila. Bruno and Alicia Vivar have a high clustering coefficient. Therefore Alicia Vivar in this network diagram has the highest degree of centrality.
Open Graph In Google Fusion Table