This week, I read Introduction: Possession which is a story about a royal family, specifically the queen, who discovers the amount of passion involved in life and death. The most important aspect for the narrator is how she discovers the amount of passion that she had for the dog, Leo. She discovers her passion has no limits in life and death.
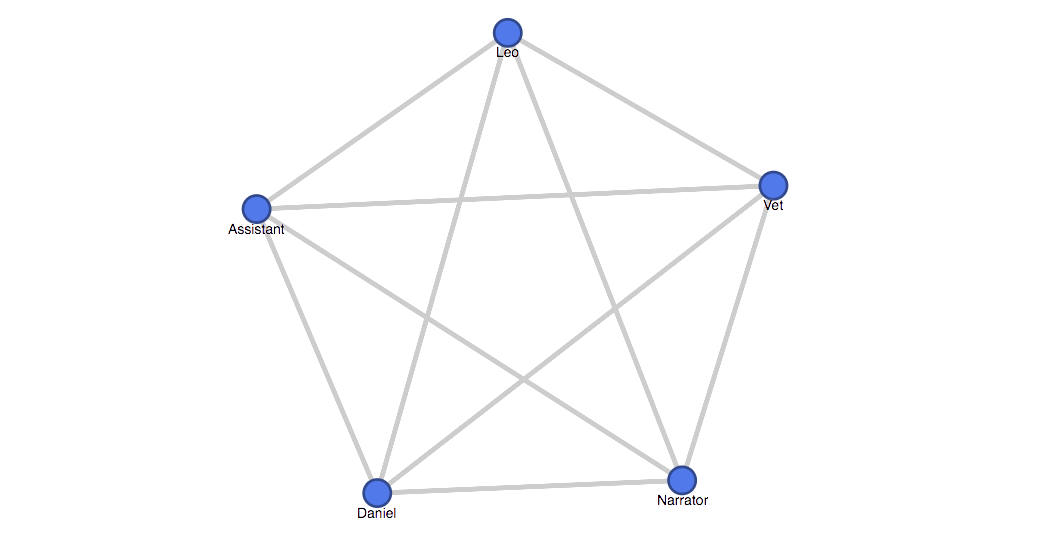
I created a network graph which shows how connected all the characters in this short story were, depicted below.
https://www.google.com/fusiontables/DataSource?docid=1sPkzY69xHmuv46pbGDBLer6vfoAYhPMr6WQ8z3fI
The graph shows how the dying dog brought together both family and non-family because of the connection with all of the members involved wanting to save the dog. This illustrates the story’s underlying theme of passion with regards to love and death. Unfortunately, the graph doesn’t show any specific relations with the characters of the story. So, for example, the graph does not show that Daniel is the son of the Narrator.
These types of networking graphs are very useful for many things including understanding complicated story plots. One instance where I think this type of graph would be extremely useful is in Shakespeare’s plays such as Hamlet or MacBeth where character relations can become confusing.