This is my Google Fusion Table. This table was created off of the story “Her Lousy Shoes” by Tracy O’Niell. This story is about an unhappily married teacher named Douglas. He is married to a woman named Miranda who has a secret lover.
The fusion table that I made was made with the characters as the nodes who are to be connected. The nodes are connected with edges. The edges that I used when making my metadata on excel was which characters knew one another. I at first had wanted to find a way to display what specifically were the relationships between each character but it was difficult to be consistent with all the characters since most characters are only mentioned a couple times and it is difficult to map out all of the relationships that each character holds.
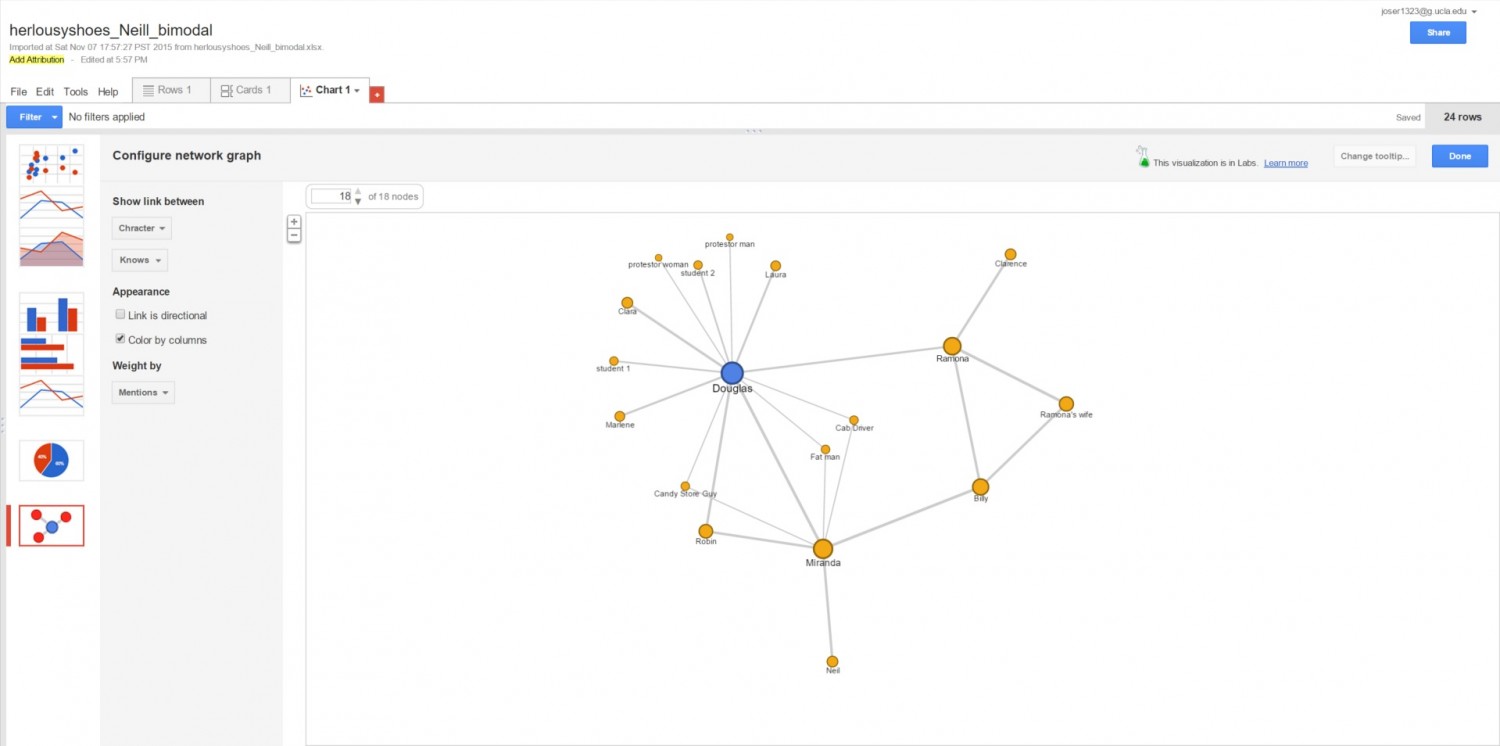
After I had read the short story and published my Fusion Table I realized that there was an option for weight. I decided to redo my data so that I could introduce weight. I wrote down the number that each character was mentioned in the text and used that as my measurement of weight and the result is the table seen above. This is the reason why Douglas has a larger node icon, a larger circle, compared to less significant characters like his students.
The chart is useful because it helps to unpack why certain events happen in the short story as they do. For example, Douglas’ wife Miranda has a secret lover that Douglas has not confirmed exists but suspects Iit. A reason why Douglas has not been able to confirm his wife’s affair is because her lover Neil as no edges to any other character that can be traced to Douglas other than his wife who obviously won’t confess. This is both a strength and a weakness of the table. While the chart shows the relationships of characters, it does not portray how much information can travel through these characters or what information (when it happens to be specific pieces of information) are reluctant to travel throughout the network. One of the limitations of the chart is that it lacks a dimension of depth as to how strong the relationships are and the specifics of the information. This is an ongoing issue with technology simplifying human relations as information is lost. That is not to say that this data does not give a new meaning when reading a short story when one can see the connection each character has at all times as we read. All the relationships are accounted for and easy of the reader to keep in mind when the network is displayed visually.