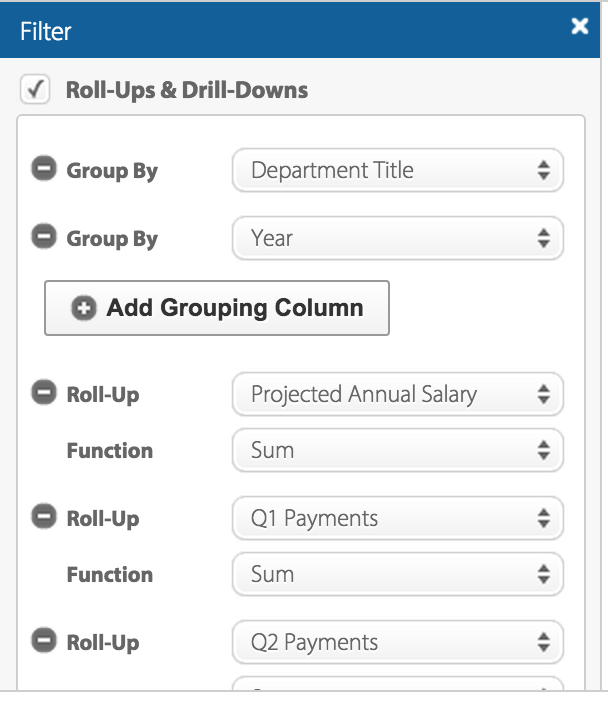
L.A. Controller’s Office breaks down the total earnings of each city department in this data set. The Office uses monetary data, each record consisting of the total earning of a city department, to increase transparency about the department that most heavily relies on the tax payers’ money. The data set can be visualized in multiple ways: pie chart, bar graph, line graph, donut chart, etc. Users can also customize the filter to reorganize the data by year, projected annual salary, quarterly payments, department title, etc.
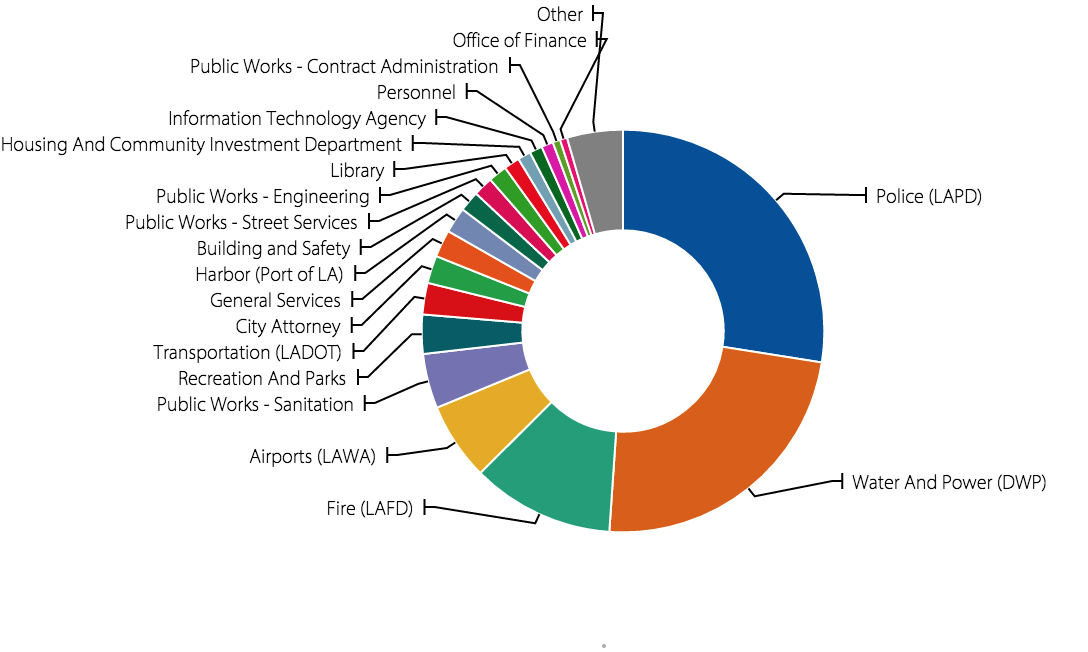
According to Wallack and Srinivasan, a dataset’s ontology is a “system of categories and their interrelations by which groups order and manage information about what’s around them.” In other words, ontology is a way of organizing information in a dataset through categorization. Ontologically speaking, this particular dataset is categorized by department title, which serves as the “boundary” that enables us to compare groups of information. This ontology makes the most sense from the point of view of U.S. citizens who reside in Los Angeles. It is through their tax money that the city’s departments sustain operations that benefit L.A. residents, making them the stakeholders of the departments’ finances. It is critical that they are aware of how much each department makes because only then can you make judgements about your “money’s worth.”
According to the data set, LAPD has the highest payroll with total earnings of $1,299,609,453.87, followed by the Department of Water and Power, with total earnings of $1,114,504,612.43.
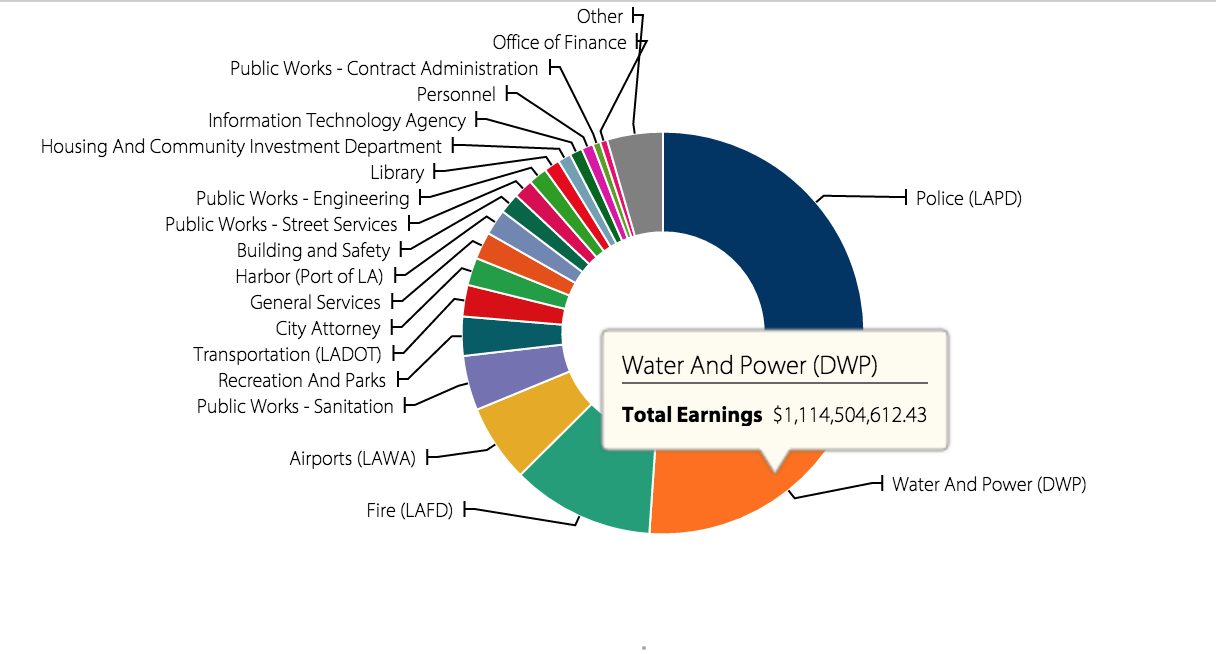
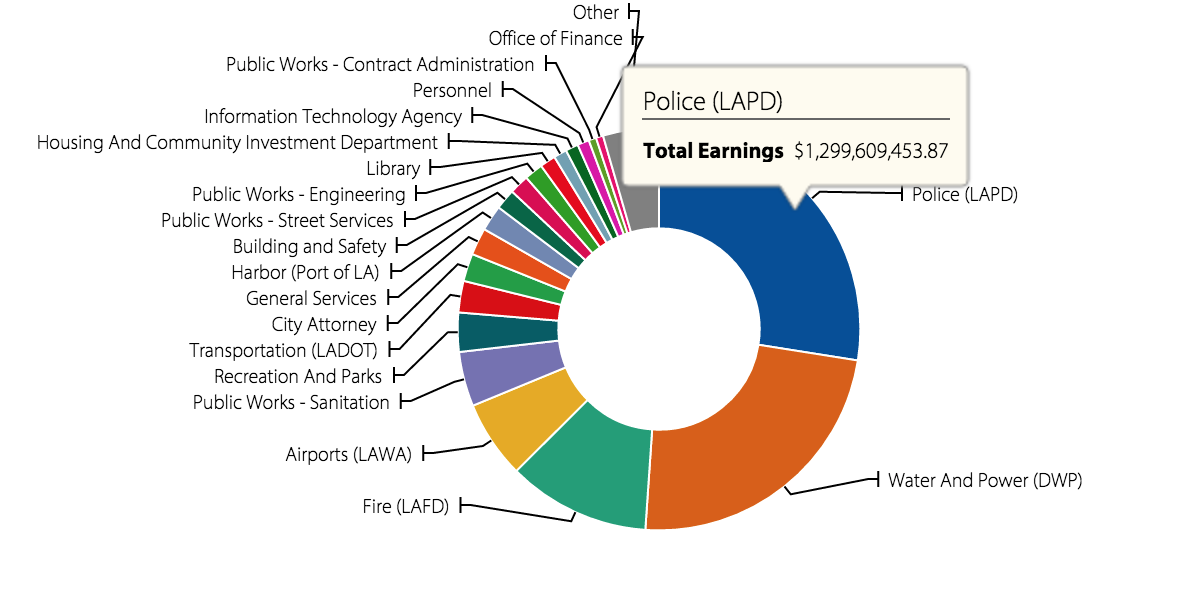
More than half of the total sum of departmental payrolls goes into supporting these two departments, which hints upon the high crime rate and severe drought in Los Angeles. The task of curbing crime in a major metropolis such as Los Angeles is costly. Also, it makes sense that a large portion of the tax payers’ money is going into providing water for local communities, given that water is in high demand and short supply in Los Angeles these days.
The data set leaves information about why payroll is distributed in such way. From the perspective of a politician who may be interested in learning more about how to more efficiently distribute funds to each department, it would be helpful to organize the data according to use – use meaning, the reason for which the department was designated a certain amount of payroll in comparison to other departments.