Week 6: Airplane Networks

title

http://www.aaronkoblin.com/work/flightpatterns/

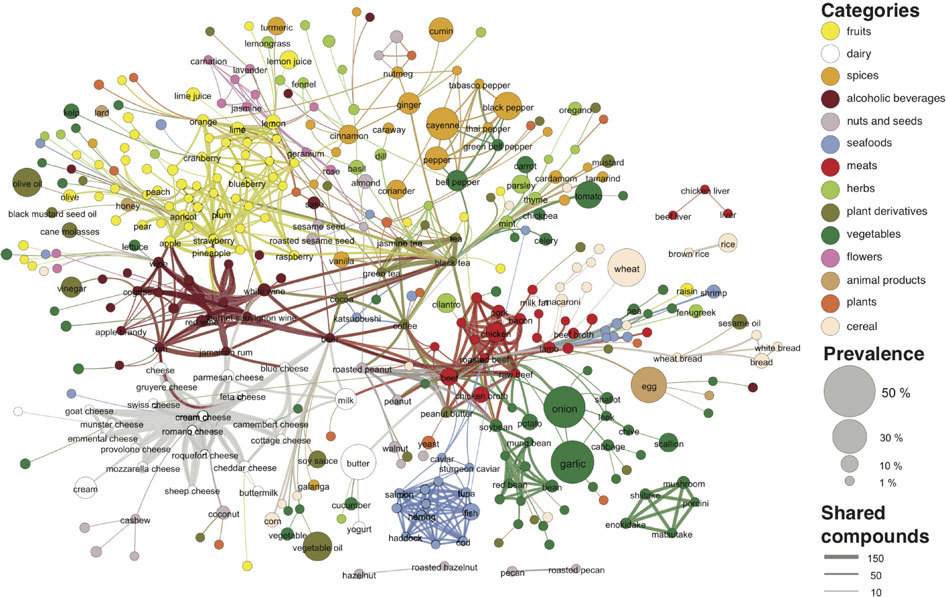
Demystifying Networks by Scott Weingart describes the beginnings of networks and how they can be used today within the digital humanities setting. Before the reader gets too excited on networks, Weingart gives a few warnings when dealing with networks – 1) yes networks can be used on an project, but that does not mean they should be. Networks only work for certain projects, and we must not get carried away when using them otherwise they will appear and become misused. 2) “methodology appropriation is dangerous” in that the methods and procedures one used on one network are not the same when working with a different set of data. Borrowing these methodologies can be even more dangerous because the users lack the knowledge to apply them correctly.

Weingart also covers “stuff”. Within his topic of stuff there are nodes, the connectors and organizers between the stuff. Nodes have attributes, or contain data on the stuff. Demystifying Networks uses books as the example of stuff. Different examples of books (dictionary, Poe collection, Harry Potter, etc) are the nodes. The title, number of pages, and author are node attributes. The next overarching topic is “relationships”. Weingart nicknames them “edges”, and defines them by the nodes that they connect. Continuing the book example, he takes person Franco Moretti and lists the edges that contain Franco Moretti – that he is an author of Modern Epic and Graphs, Maps, and Trees.

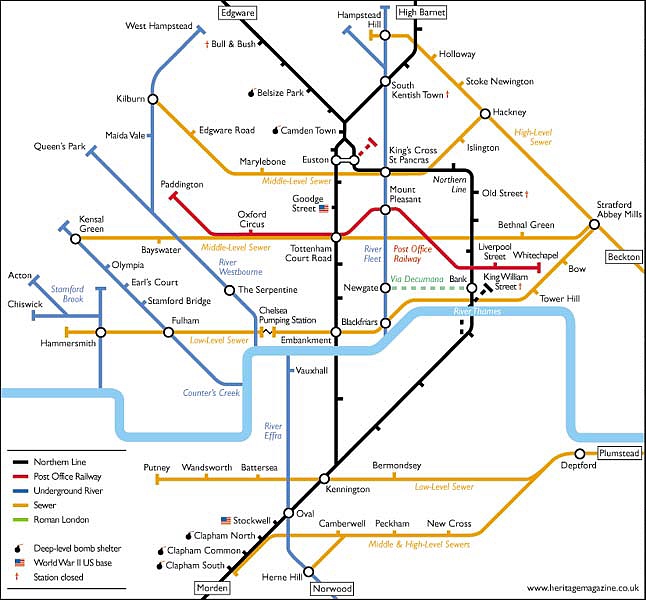
I took a network created by a UCLA alumni and applied what I learned from Demystifing Networks. Aaron Koblin is a Design Media Arts graduate (especially cool since I’m also in DMA) who represented visually and interactively the network of flight patterns across the United States. The project is part of a series called Celestial Mechanics, “a plalanetarium-based artwork installation that visualizes the statistics, data, and protocols of manmade aerial technologies. However, these specific renderings show the altitudes, makes, and models of over 205,000 different aircrafts being monitored by the FAA on August 12, 2008. You can filter which aircraft you wish to see, zoom in on specific areas of the map, and even download high quality images for your desktop backgrounds because the resulting maps are so gorgeous.

With this example, defining the stuff, nodes, and relationships are more difficult because there is no database available to the public. I can say that the stuff is each individual airplane with its unique destination; the nodes are the airports (connecting the planes together); the attributes of the stuff is the aircraft, its altitude, the number of passengers, the flight number, etc; the attributes of the nodes is the size of the airport, the address, how many terminals it has, and if it’s an international airport or purely domestic; and finally, the relationship between the planes and airports could be which airline owns the plane and if its available at the airport. Visually, I don’t think there’s a more stimulating network graphic than this one. But with the promising future of networks, undoubtedly someone will take inspiration from Koblin’s work and stretch the boundaries of beautiful network visualizations.

Finding media you can use on the Web

I can illustrate this post with this cute picture of a puppy because the Flickr user 23am.com has licensed it CC BY — meaning I can do whatever I want with this picture as long as I credit him or her. Here’s the original photo.

Since you’re going to be using lots of different media for your projects, it’s probably a good idea to go over what kind of things are safe to post and re-post on the Internet.

Alas, we’re not legally allowed to reuse and remix anything we want. Say, for example, I wanted to illustrate this post with this photograph of Hillary Clinton and Benjamin Netanyahu. Sadly, I cannot, because it’s under copyright by the European Pressphoto Agency. (In practice, would anyone know? I don’t know. But it’s good to be aware of these things.)

Fortunately, smart people have thought about the problem of reusing and remixing stuff you find on the web. And there are a few categories of media that you’re safe to use.

Creative Commons licenses are designed to be less restrictive than regular copyright licenses. By attaching a Creative Commons license to something you create, you can give other creators various levels of permission to re-use your stuff:

  • Other people can do pretty much whatever they want with your stuff — remix it, tweak it, whatever — as long as they give you credit. That’s called CC-BY.
  • Other people can do whatever they want with your stuff, as long as they give you credit and allow others to do the same with the stuff they make from your stuff. That’s CC-BY-SA.
  • Other people can post your stuff, but they’re not allowed to remix it or create derivative works from it and they must give you credit. That’s CC BY-ND.
  • Other people can repost and remix your stuff, as long as they give you credit, but their new works must be non-commercial. That’s CC BY-NC.
  • Other people can remix your stuff, as long as they use it non-commercially, give you credit for it, and give other people the same license terms with the new work. That’s CC BY-NC-SA.
  • Other people can share your work, as long as they credit it to you, but they can’t change it in any way or use it commercially. That’s CC BY-NC-ND.

There’s also a category of stuff that’s under even fewer restrictions than Creative Commons licenses. That’s material in the public domain. Works enter the public domain in a number of ways: they age out of copyright restrictions, they’re published by the government, or the creator explicitly dedicates his or her work to the public domain. If work is in the public domain, you can do whatever you want with it. This chart is the best guide I know to determining whether something is in the public domain. A good general rule of thumb: If something was published before 1923, it’s probably in the public domain.

Finally, even if something is under copyright, there’s a chance you can use it, depending on the way in which you use it. The name for this category is “fair use,” which generally means you’re using a portion of the work for a non-commercial purpose, and your use won’t detract from the work’s commercial value. Fair use is murky, more the product of a set of decision calls than one hard-and-fast guideline. Here is a worksheet designed to help you evaluate whether you can use something under fair use.

Finding this stuff

A number of search tools make it relatively easy to identify material that you can remix and repost.

  • Creative Commons Search allows you to search for images, music, video, sound with different levels of CC licenses.
  • My favorite way to locate CC-licensed images is to use Flickr’s advanced search feature.
  • Everything on Wikipedia is published under a CC license or is in the public domain.
  • The Internet Archive offers a wealth of video, texts, audio, and other media to reuse.
  • Many DH people are aware of the importance of CC licensing and explicitly attach CC licenses to their work. For example, if you look closely at the bottom of Bethany Nowviskie’s blog, you can see that she’s licensed it CC-BY.

So look for the Creative Commons license, or check to see if something’s in the public domain, and you should be good.

Week 6: Text Analysis

I did not realize how text analysis could help discover more about the actual subject and perhaps help form an argument or additional conclusion about the text. Reading about Andrew Smith’s commentary on the Criminal Intent Project and the text analysis of all the Old Bailey court cases from 1674 to 1913. They analyzed 198,000 trials. Researchers found that beginning in 1825 there was an unusual peak in the number of guilty pleas and short trials, whereas before 1825 most of the trials were full trials in which people did not plea guilty. Researchers also found that the number of men defendants started to outweigh the number of women defendants. These findings helped to advance the understandings of the Old Bailey court cases and helped to gain more insight on the changes in the history of court cases in London.

Until I was exposed to text analysis in Digital Humanities and did a little more research on the background of text analysis tools like Voyant I did not realize how helpful of a tool it is. Reading about some background information, I learned that Voyant credits some of its textual analysis skills towards Google because like many other search engines Google focuses on search and retrieval of text content. It also references how Google sets a “standard for simplicity in interface” when browsing the default search page. Now compare the default search page of Voyant to Google and how the Voyant search page includes one box to begin text analysis. I recognized that Voyant and Google are similar in the aspect of simplicity because of the inclusion of a single search box. I did not think of Google, something I use everyday, as a type of text analysis. Learning more about the process of analyzing text and how it can lead to retrieving new texts or formulating new arguments has been useful for my DH project research. Text analysis is something I hope to use more of throughout my research projects.

http://docs.voyant-tools.org/context/background/

Food Web

In “Demystifying Networks”, Scott Weingart explains the basics of networks along with the conceptual issues that go along with them. First he begins with a couple of warnings that one may encounter when network analysis is used in various projects. His first warning is that networks shouldn’t be used on all projects even though networks have the potential to used on all projects. We might be eager to try using networks in our digital humanities projects as we learn more about them but we should give our projects more thought and think about other tools we can use to better suit our needs. Weingart’s second warning is that “methodology appropriation is dangerous”. Here, he explains that theoretical and philosophical caveats get lost once methodologies get translated. Borrowing methodologies can be even more dangerous because we will lack the full understanding to use and apply them properly.

Next, Weingart goes into the basics of networks. He explains that a network is a “complex, interlocking system. Stuff and relationships”. The “stuff” is basically anything that exists — a subject — for example, books. He calls an assortment of stuff as “nodes” and relationships in a network as “edges”. When Weingart explains what networks are I began to think about a food web. I did a quick search and found an interesting image of a network of different foods.

flavour-network


In this example, the author takes the food-paring hypothesis, which states that ingredients work together in a dish if they share similar molecular compounds, and endeavors to create a flavor network. So in this specific example, the relationship in the network or “edges” are the shared flavor compounds. For example, shrimp and parmesan are connected because they contain the same flavor compound 1-penten-3-ol. The “nodes” here are obviously the different kinds of foods or ingredients. The size of each node reflects how often that specific ingredient is used in recipes. Moreover, the thickness of the line shows the relative number of shared flavor compounds. The different colors in the image represent the different food categories such as fruits, dairies, meats, herbs, etc. I thought this was such a great example of a network and the complexities that go along with it. The data visualization that the creator used to portray all the information is particularly interesting because it lets us view data in multiple ways without actually reading it. A network like this would be especially useful for chefs or anyone who is interested in cooking and would like to know the relationships between ingredients and if they would mix well with one another.

Week 6- Networks and Transportation

In the Scott Weingart article “Demystifying Networks,” he breaks down the the origins and uses of Networks, specifically illuminating them in a digital humanities setting.  In the introduction, he starts basic stating that networks are things which show connections between “stuff.”  This stuff is given the more formal term of “node” to denote that it is a spot between relationships.  These nodes can be “bi-modal” or “mulit-modal” meaning that there are more than one type of node in a system.  The relationships which connect the nodes are referred to in this article as “edges.”  These edges can be “directed edges” or “un-directed edges.” Directed edges mean that the relationship can only go in one direction, the order of the nodes is causal and cannot be reversed.

With this basic understanding of network relationships, I started thinking about examples of networks in daily life.  Initially, I got stuck on the idea of the internet, perhaps the ultimate network.  At work last week, I heard two of my colleges go over an analogy for the inner workings of internet that I had not heard before, or perhaps it just didn’t stick with me.  They were discussing the analogy of the internet as a highway: the cars moving being the data communicated and the physical infrastructure being the “metaphorical highway.” This concept really stuck with me: why is it easier to understand a network through an analogy rather than its actually process? Why transportation networks?

LondonUndergroundMap

A quick google brought me to an image of the London subway which with its stops and lines, looked very much like the network examples given in the Weingart article.  The circles represent nodes and the lines each represent an “undirected edge.” This example made me realize that networks are things which are encountered constantly in modern daily life: much of infrastructure (invisible or invisible) is organized through the system of  network.  This familiarity is perhaps what makes it such a good model for understanding more complex or conceptual networks.

In thinking about digital networks, I am still stuck on the idea of visualization.  As made clear in the Weingart article, networks are held, in common conception, as complicated entities especially in the context of large data sets. Weingart explains the need to often cut down on the data visualization, to make a graph “sparse” instead of “dense.”  This perhaps answers my earlier question, maybe we need to simplify our understanding of networks such as the internet, in order to actually conceive the basics of the network.  Maybe the purpose of the network is to not understand it in “full” so to speak, but to understand the system to the point where it can be used? What is the purpose of a network visualization? To what point “should” one trim data to make a point?


Finding Paul Revere

Kieran Healy’s article on finding Paul Revere with metadata was very interesting. Aside from the clever point of view of a Royal Security Administration analyst, Healy had some very interesting points to make about metadata. Basically, using only information tracing individual membership to multiple “terrorist” groups, Healy could make some really interesting and useful insights deeper into the data. Initially, the author is able to convert the table from People vs. Groups to a People vs. People table – Healy does this by multiplying the matrix (table 1) by its flipped self (transpose of table 1). This simple equation allows the author to quickly manipulate the data and to start drawing relations between different people that it might otherwise have taken quite a bit of time to discover manually. Regardless, Healy is left with links between people as they are members of the same rebel group. This works in the same way but with the multiplying matrices equation flipped. In this particular case, the author was left with a table of Groups vs. Groups, elucidating how many members each set of groups shared in common. In either case, some quick and easy data visualizations make it obvious quite quickly which groups and/or people were at the heart of the rebel colonial cause.

I believe this case study has some interesting applications in situations where your metadata collection is limited for some reason. In this case, Healy had only the information on group membership to work with, and was able to tease out some very useful relationships (which were there all along but one would probably not have picked up on without the manipulation and data visualizations). For instance, in archaeology our data sets are often limited to information like what types of objects we find and where we find them. Since we study the distant past, it is very unusual to have more information, for instance the name of the artisan who made the item, or who it belonged to. However, Healy’s methods seem to have good applicability in these cases. If for instance we could put together a spreadsheet of pottery types vs. their find locations across a large region, nation -state, or even area like the Eastern Mediterranean, then perhaps we could begin to tease out some central nodes in the data. These nodes may then correspond with production centers, and could help us to understand trade or redistribution patterns in pottery.

Week 5: Networks + Linkedin

I really enjoyed learning about networks from Scott Weingart’s post, “Demystifying Networks”. It made me realize how common networks are in today’s digital world, and also how often they are utilized by websites we commonly visit. One of the social sites I thought about while reading was Linkedin.

Linkedin is very much a literal representation of how networks work. It’s a site that lets you connect with other professionals who are in the same career field as you or career fields that interest you. Based on the people you know, Linkedin will also provide recommendations for you to connect with individuals it thinks belong in your “social circle”, as you might say. One of my fellow classmates discussed the idea of “six degrees of separation”, which means that it means you are connected to someone in some way through 6 other people. Linkedin is a somewhat good example of that. If you don’t know someone, you’ll often see that you know someone that does.

Linkedin used to have a data visualization feature that allowed you to see how you connect with those around you. Unfortunately, it no longer supports it. Personally, I wish they still kept it because it’s a very visual representation of your professional network, and it’s represented in an interesting way.

The photo above is an example of what the feature used to be able to show you when you wanted to see what your network looked like. It would use “edges” to connect you from your name to the person you were connected with. The color of the edges determined how you knew that person. Whether it be through the “social media” field or others. This person, obviously, has a huge number of connections, which can be seen here in their networks. And though this particular individual’s networks are extremely complex, it just shows how interconnected we are.

I believe the reason Linkedin stopped this feature is because it really wasn’t a central point to their site. Weingart touches upon this subject in his article, that “networks” should not necessarily be used for everything. To him, they’re used far too often and for the wrong reasons. That’s true, and I understand this feature wasn’t ultimately Linkedin’s priority. They may have thought of it as something that looks pretty, but serves no purpose. Personally, I think it’s just a nice additional feature to have on the site, but I understand why they wouldn’t want to waste their money or time maintaining that feature for their users.

Source: Scott Weingart, “Demystifying Networks

Linkedin.com


Week 6: Twitter Network Analysis

In his blog post, Scott Weingart offers his explanation of how a network works. He gets down to the fundamental basics of what makes a network and simplifies them into terms even people with little-to-no background in math can understand. He acknowledges the flexibility of the network as a tool, which can be applicable to any data studied within network analysis. However he warns that the network tool should not be abused and should be selectively used. He also warns that the appropriation of data, especially when it comes to that of humanities scholars who are, “often dealing with the interactions of many types of things, and so the algorithms developed for traditional network studies are insufficient for the networks we often have.”

Weingart breaks down the components of any network to ultimately be simply “stuff and relationships.” These components are interdependent and their connection cannot exist without each other. He then performs a run-through of a very simple network formation starting with books as nodes before connecting their variety of attributes to form relationships, or edges.

After reading Weingart’s post, I came across an impressive, preliminary study on Twitter’s billion-scale network conducted by Masaru Watanabe and Toyotaro Suzumura of Tokyo Institute of Technology. While reading through their process and concluding results, I was delightfully surprised at how I was at least able to identify key terms in their comprehensive study after reading Weingart’s explanation. This made it a lot easier to approach Watanabe and Suzumura’s study which I found to also be fairly straightforward in general. The process of their study however is far from straightforward and seems highly complex considering the amount of data they collected among 469 million users between the months of July to October 2012. They categorized the data, which included follower-friend information, into two formats, XML and CSV and also utilized the analysis tool, Apache Hadoop and later HyperANF to compute the degree of separation.

Inspired by a Facebook network analysis study conducted by Lars Backstrom who managed to compute a degree of separation using graph analysis tool, HyperANF and resulted in a surprisingly low number of 4.74. The network structure of Facebook is more friend-based that resembles the way human relationships work in the real world, while a social graph like Twitter is based more on interests and differs from Facebook due to its directed graph. Directed graphs allow everyone to follow someone freely while an undirected graph like Facebook requires approval. Considering that Facebook and Twitter have a different network structure, Watanabe and Suzumura analyzed Twitter’s network in an attempt to compute a degree of separation and diameter. Interestingly, both degree of separation  and diameter are used to measure networks in terms of scale and graph. Degree of separation is found by the average value of the shortest-path length of all pairs of users while the diameter is given through the maximum value. For the data collected within July to October 2012, the analysts concluded in a degree of separation of 4.59 in the Twitter network. After reading a simplified explanation of what makes a network and its analysis, it was interesting to see this applied to a large-scale network like Twitter.

http://www2013.wwwconference.org/companion/p531.pdf

Week 6: Simplifying Networks

While reading “Demystifying Networks,” I kept wondering how spreadsheets for my final project would fit into the structures that the author was talking about. My data has nodes, but instead of one article of “stuff” per node, I had multiple. For example, in my category of “ingredients,” I have many different foods, and I was afraid that my situation is what the author is describing as difficult to translate into a network. “Once you get to three of more varieties of nodes, most algorithms used in network analysis simply do not work; most algorithms were only created to deal with networks with one variety of node.” If I understood correctly, my spreadsheets contain more than one variety of stuff per node. I scrolled down to the comments, and I found someone with a similar problem to mine – figuring out how to translate my complex data into a network visualization, that is. The author’s response was that although this type of data was possible to visualize through some kind of algorithm, it wasn’t the best way to go about solving this problem. Instead, the author suggested multiple ways of visualizing the data, because one method would not be enough. This is kind of what I was already doing to solve my problem – I had created a word cloud, and the data that the word cloud had narrowed down for me could be something that I plug into a new spreadsheet and visualization. “An option might be to represent each node type individually in a separate representation,” the author suggested, in order to easily translate spreadsheet into something visually readable. Then, these individual representations could be combined to see a bigger picture. Although I wish I could visualize something like the image I attached below of the Flavor Network, the process is too complicated for me to translate into a spreadsheet that visualization programs can read. It also might result in too much data in the visualization, because although the Flavor Network looks interesting and connected and color coordinated, there are a lot of connections that are too small to be interpreted, and therefore that data is lost.

srep00196-f2

Arranged Marriages Using Networks

As Stephen Ross describes in his essay “Demystifying Networks” networks are a “net-like arrangement of threads and wires” later to stand for an interlocking system aka stuff and relationships. Something that I can speak on behalf of is the concept of arranged marriages. Now my reader is seeing the word arranged marriages from an individualistic societal perspective. I beg that they don’t. Arranged marriages are a reflection of a collectivistic culture and to say that it is backwards or “not right” is insulting and dehumanizing an indentity. Moving forward, the way that arranged marriages operate is essentially through a network. For example, you feel like you’re at the right age to get married. Your mother and father will spread the word through their friends that you want to settle down. They will spread the news through a network. Each friend of your parents’ also has a network which the news will spread through. And so on.

Now you could be satisfied to marry someone so far along networks that you can’t really see how you found each other, but that isn’t the point. What you really strive for in this process is someone from a network you relate to, can vouch for the family. So you would want to marry into a family preferably from your aunt’s network, because presumably your aunt is a trusted source. Your parents would be the centrality as they decided that your aunt is an important part of the network to give responsibility to. So the concept of arranged marriages is entirely based off of networks.

I came to this idea of arranged marriages as a network after watching this commercial someone had sent to me over Facebook.

Just as a post note, there are different types of ways to approach arranged marriages. It’s not an oppressive way to trap women. (Though we are in modern times, I would be an idiot to not recognize that forced marriages do occur still.) The arranged marriage that I am describing in my post is a typical Pakistani manner of an arranged marriage in which both prospects have the freedom to say no, yes, etc.