Author: miriamposner
Creating a Network Graph with Gephi
Gephi is a powerful tool for network analysis, but it can be intimidating. It has a lot of tools for statistical analysis of network data — most of which you won’t be using at this stage of your work.
Open Gephi

Be sure you’re on the Windows side of your computer and that you’re opening Gephi version 8.2. (Gephi 8.2 for Mac doesn’t work; if you want to use Gephi at home and you have a Mac, be sure and download 8.1.)
Create a new project
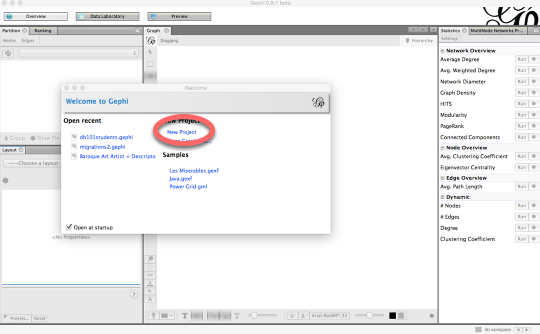
Click on New Project on the “Welcome to Gephi” popup window.
Do not freak out.
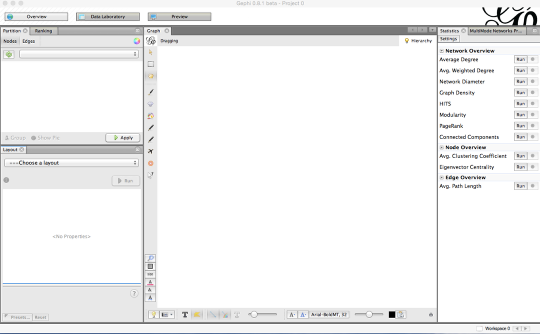
The Gephi workspace looks really confusing and intimidating. Do not freak out.
Click on "Data Laboratory."

This is where you’ll upload your data.
In the Data Laboratory, click on "Import Spreadsheet."

Click on Import Spreadsheet in order to upload your data.
Import "DH101 6B Dataset 2 node list" as a Node table
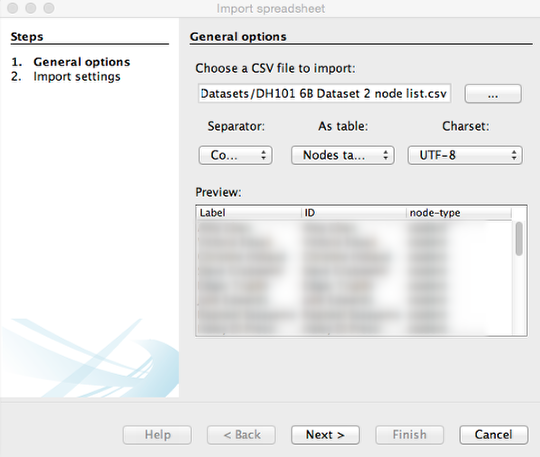
1) Click on the button with the three dots on it to select a file and click on DH101 6B Dataset 2 node list.
2) Be sure you choose Nodes table from the box that allows you to choose between an edge table and a node table.
3) Finally, click Next to move on to the next screen and Finish on the window that follows.
Import "DH101 6B Dataset 2 edge list" as an Edges table
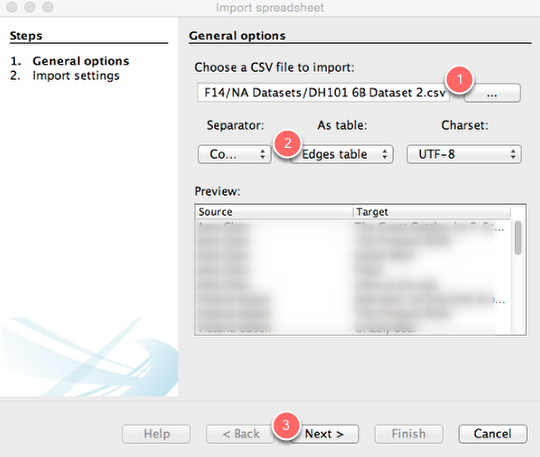
1) Click on the button with the three dots on it to select a file and click on DH101 6B Dataset 2.
2) Be sure you choose Edges table from the box that allows you to choose between an edge table and a node table.
3) Finally, click Next to move on to the next screen and then Finish on the following screen.
What is this, it’s confusing and I hate it.
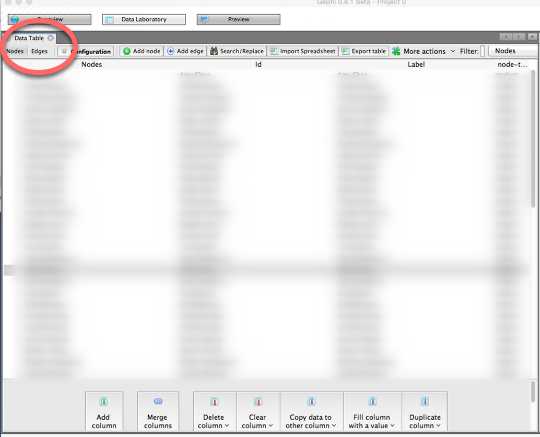
This is where you can manipulate the data you’ve uploaded. If you click on the Nodes or Edges tab, you can toggle between spreadsheets. For the time being, however, we’re not going to change anything.
Click on "Overview."

OK, we can finally start visualizing. Click on Overview to go to the pane that will show your network graph.
Cool, I guess?

You now have a network diagram! You can’t really see much, though.
Manipulate your diagram so it’s more legible.
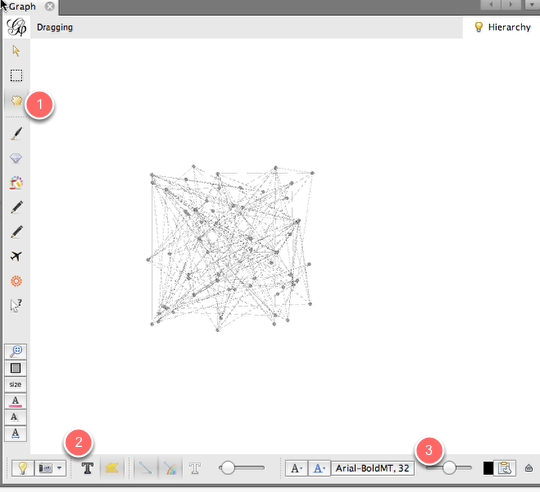
Use the scroll wheel to zoom in and out. 1) Use the hand icon to move the diagram around. 2) Turn labels on by clicking the T. 3) Adjust the size of the labels with the scrubber.
What are we looking at?
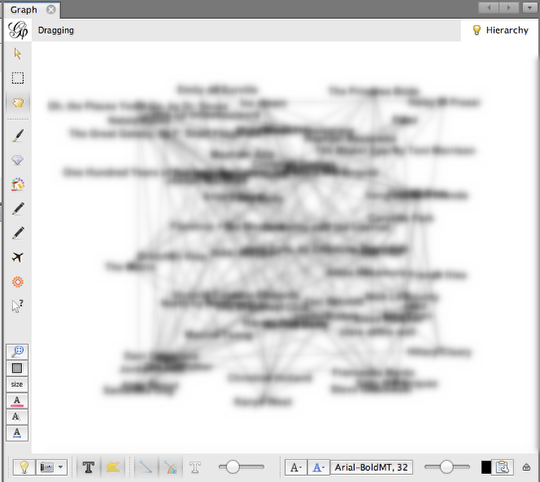
This is a bimodal network graph, meaning it contains two different kinds of things: students and preferences. Each student is connected to his or her preferences with an edge. It’s still a little hard to see anything, though.
Separate "students" from "preferences."

Let’s add some color so we can distinguish between students and their preferences. On the upper left-hand portion of the screen, you’ll see a box that has two tabs: Partition and Ranking. Be sure that the Partition tab is selected (1). Then, within the Partition tab, be sure that the Nodes tab is selected (2). Click the button with the two green arrows to refresh your selection (3). Then, from the dropdown menu, select node-type (4). Finally, click Apply (5).
Now you can distinguish students from their preferences.

Calculate average degree.
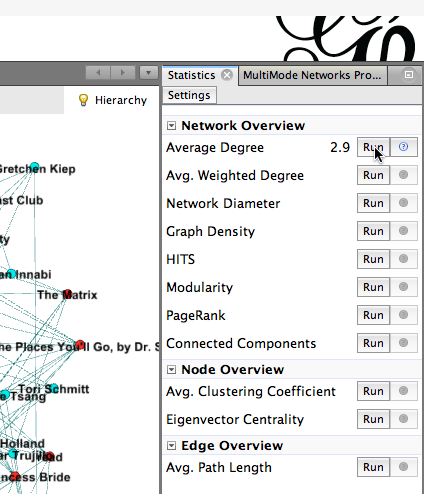
Let’s make the more popular nodes bigger, to indicate that more students have chosen them. To do that, we need to calculate the nodes’ Average Degree. To do this, head to the right side of your Gephi window, where you’ll find a Statistics page. Click the Run button that appears to the right of Average Degree. Then close the Degree report that pops up.
Size nodes according to their popularity.
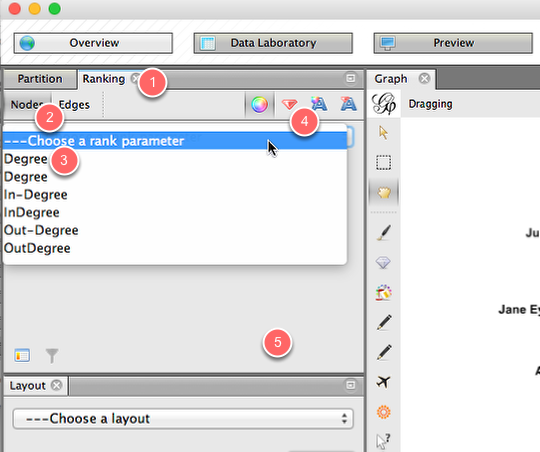
Now let’s use the average degree, which we just calculated, to size the nodes. Head back to the left side of the Gephi window, and this time click on the Ranking tab (1). Within that tab, click on Nodes (2), and from the drop-down menu, click on Degree (3). Click on the tiny red diamond to rank nodes by size (4). Then hit Apply (5).
Now you can see who chose what, and how popular those choices were!

Calculate modularity.

Let’s see if we can identify clusters of students who have things in common. To do this, we’ll calculate modularity. On the Statistics pane (at the right of your screen), click on the Run button that appears next to Modularity. In the next popup window, click OK, then click OK in the next window.
Color your nodes by community.

Now that we’ve calculated modularity, we can color nodes according to their communities. To do that, go to the Partition pane (on the left side of the Gephi window) and click on the little Refresh icon (1). From the dropdown window, select Modularity Class. Finally, click
Now we have communities.
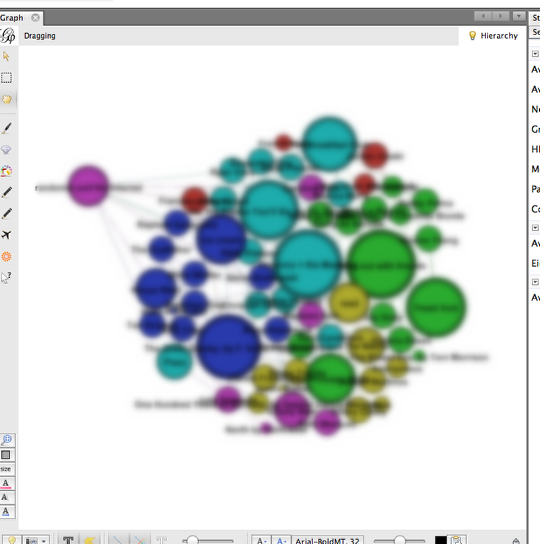
Now we can see which students’ preferences bind them together into communities. Students who have the most in common are colored the same color, along with their common preferences.
Save and share!

You can save your Gephi graph as a Gephi file, so you can open it up again later and edit it. You can also take a screenshot from the Overview panel (click on the tiny camera). You can also click on the Preview pane to see a somewhat nicer presentation of your network diagram, and you can change the look of it on the left-hand side of that pane. (Be sure to click Refresh after each change.) Once you’re happy, click on the SVG/PDF/PNG button to export it as an image file.
Finding media you can use on the Web

Since you’re going to be using lots of different media for your projects, it’s probably a good idea to go over what kind of things are safe to post and re-post on the Internet.
Alas, we’re not legally allowed to reuse and remix anything we want. Say, for example, I wanted to illustrate this post with this photograph of Hillary Clinton and Benjamin Netanyahu. Sadly, I cannot, because it’s under copyright by the European Pressphoto Agency. (In practice, would anyone know? I don’t know. But it’s good to be aware of these things.)
Fortunately, smart people have thought about the problem of reusing and remixing stuff you find on the web. And there are a few categories of media that you’re safe to use.
Creative Commons licenses are designed to be less restrictive than regular copyright licenses. By attaching a Creative Commons license to something you create, you can give other creators various levels of permission to re-use your stuff:
- Other people can do pretty much whatever they want with your stuff — remix it, tweak it, whatever — as long as they give you credit. That’s called CC-BY.
- Other people can do whatever they want with your stuff, as long as they give you credit and allow others to do the same with the stuff they make from your stuff. That’s CC-BY-SA.
- Other people can post your stuff, but they’re not allowed to remix it or create derivative works from it and they must give you credit. That’s CC BY-ND.
- Other people can repost and remix your stuff, as long as they give you credit, but their new works must be non-commercial. That’s CC BY-NC.
- Other people can remix your stuff, as long as they use it non-commercially, give you credit for it, and give other people the same license terms with the new work. That’s CC BY-NC-SA.
- Other people can share your work, as long as they credit it to you, but they can’t change it in any way or use it commercially. That’s CC BY-NC-ND.
There’s also a category of stuff that’s under even fewer restrictions than Creative Commons licenses. That’s material in the public domain. Works enter the public domain in a number of ways: they age out of copyright restrictions, they’re published by the government, or the creator explicitly dedicates his or her work to the public domain. If work is in the public domain, you can do whatever you want with it. This chart is the best guide I know to determining whether something is in the public domain. A good general rule of thumb: If something was published before 1923, it’s probably in the public domain.
Finally, even if something is under copyright, there’s a chance you can use it, depending on the way in which you use it. The name for this category is “fair use,” which generally means you’re using a portion of the work for a non-commercial purpose, and your use won’t detract from the work’s commercial value. Fair use is murky, more the product of a set of decision calls than one hard-and-fast guideline. Here is a worksheet designed to help you evaluate whether you can use something under fair use.
Finding this stuff
A number of search tools make it relatively easy to identify material that you can remix and repost.
- Creative Commons Search allows you to search for images, music, video, sound with different levels of CC licenses.
- My favorite way to locate CC-licensed images is to use Flickr’s advanced search feature.
- Everything on Wikipedia is published under a CC license or is in the public domain.
- The Internet Archive offers a wealth of video, texts, audio, and other media to reuse.
- Many DH people are aware of the importance of CC licensing and explicitly attach CC licenses to their work. For example, if you look closely at the bottom of Bethany Nowviskie’s blog, you can see that she’s licensed it CC-BY.
So look for the Creative Commons license, or check to see if something’s in the public domain, and you should be good.


Hello world!
Welcome to WordPress. This is your first post. Edit or delete it, then start blogging!