Week 9: Soweto ’76 and “Humanities Gaming?”

While conducting research for my final exhibition, I came across an interesting and appropriate subheading for this week’s discussion of 3D and virtual environments in the Digital_Humanities reader coauthored by UCLA’s Peter Lunenfeld and Johanna Drucker, among several others at UCLA and abroad.

Under the section entitled “Humanities Gaming,” the text explains how “Digital Humanities gaming has begun to successfully engage with historical simulation, virtual cycles of competition, and the virtual construction of learning environments.” In conjunction with Diane Favro’s walk through historical simulation modeling at UCLA and Snyder’s “Virtual Reality for Humanities Scholarship,” I think interesting questions can be asked regarding both the form and function of 3D environments in academia today. Historically, games have never been held in high repute by academia, however recent developments in new media studies and narratology (the study of game narrative) have removed some of the stigma that was once attached to gaming. In the Digital_Humanities reader, several “case studies” surrounding virtual environments and interactive media are given as examples of experimental forms of interactive media that have might be incorporated into the pedagogy of the digital humanist.

One such example provided is the “Soweto ’76 3D” site, which is described as a unique 3D “archive interface” that allows visitors to easily guide themselves through a virtual recreation of the township combining both education and exploration as they learn about the places, people and past of Soweto. The front page of the site explains to visitors that with the formal end of Apartheid in 1994, public archives in South Africa underwent a massive transformation and were enlisted as vital community resources in the effort to build the fledgling democracy. According to the site, as a result of the “regularly used censorship, the destruction of documents, and restricted access to the archive as vehicles for the eradication of oppositional memories that might endanger the welfare of the state” during the Apartheid, many of the holdings of archival institutions in South Africa continue to be under threat today. The program is designed as an interactive exhibit in which users can click on locations, read about different buildings and even add their own insight and knowledge to the collection through a process of peer review.

Screen Shot 2014-12-01 at 11.17.23 AMhttp://soweto76archive.org/3d/video/

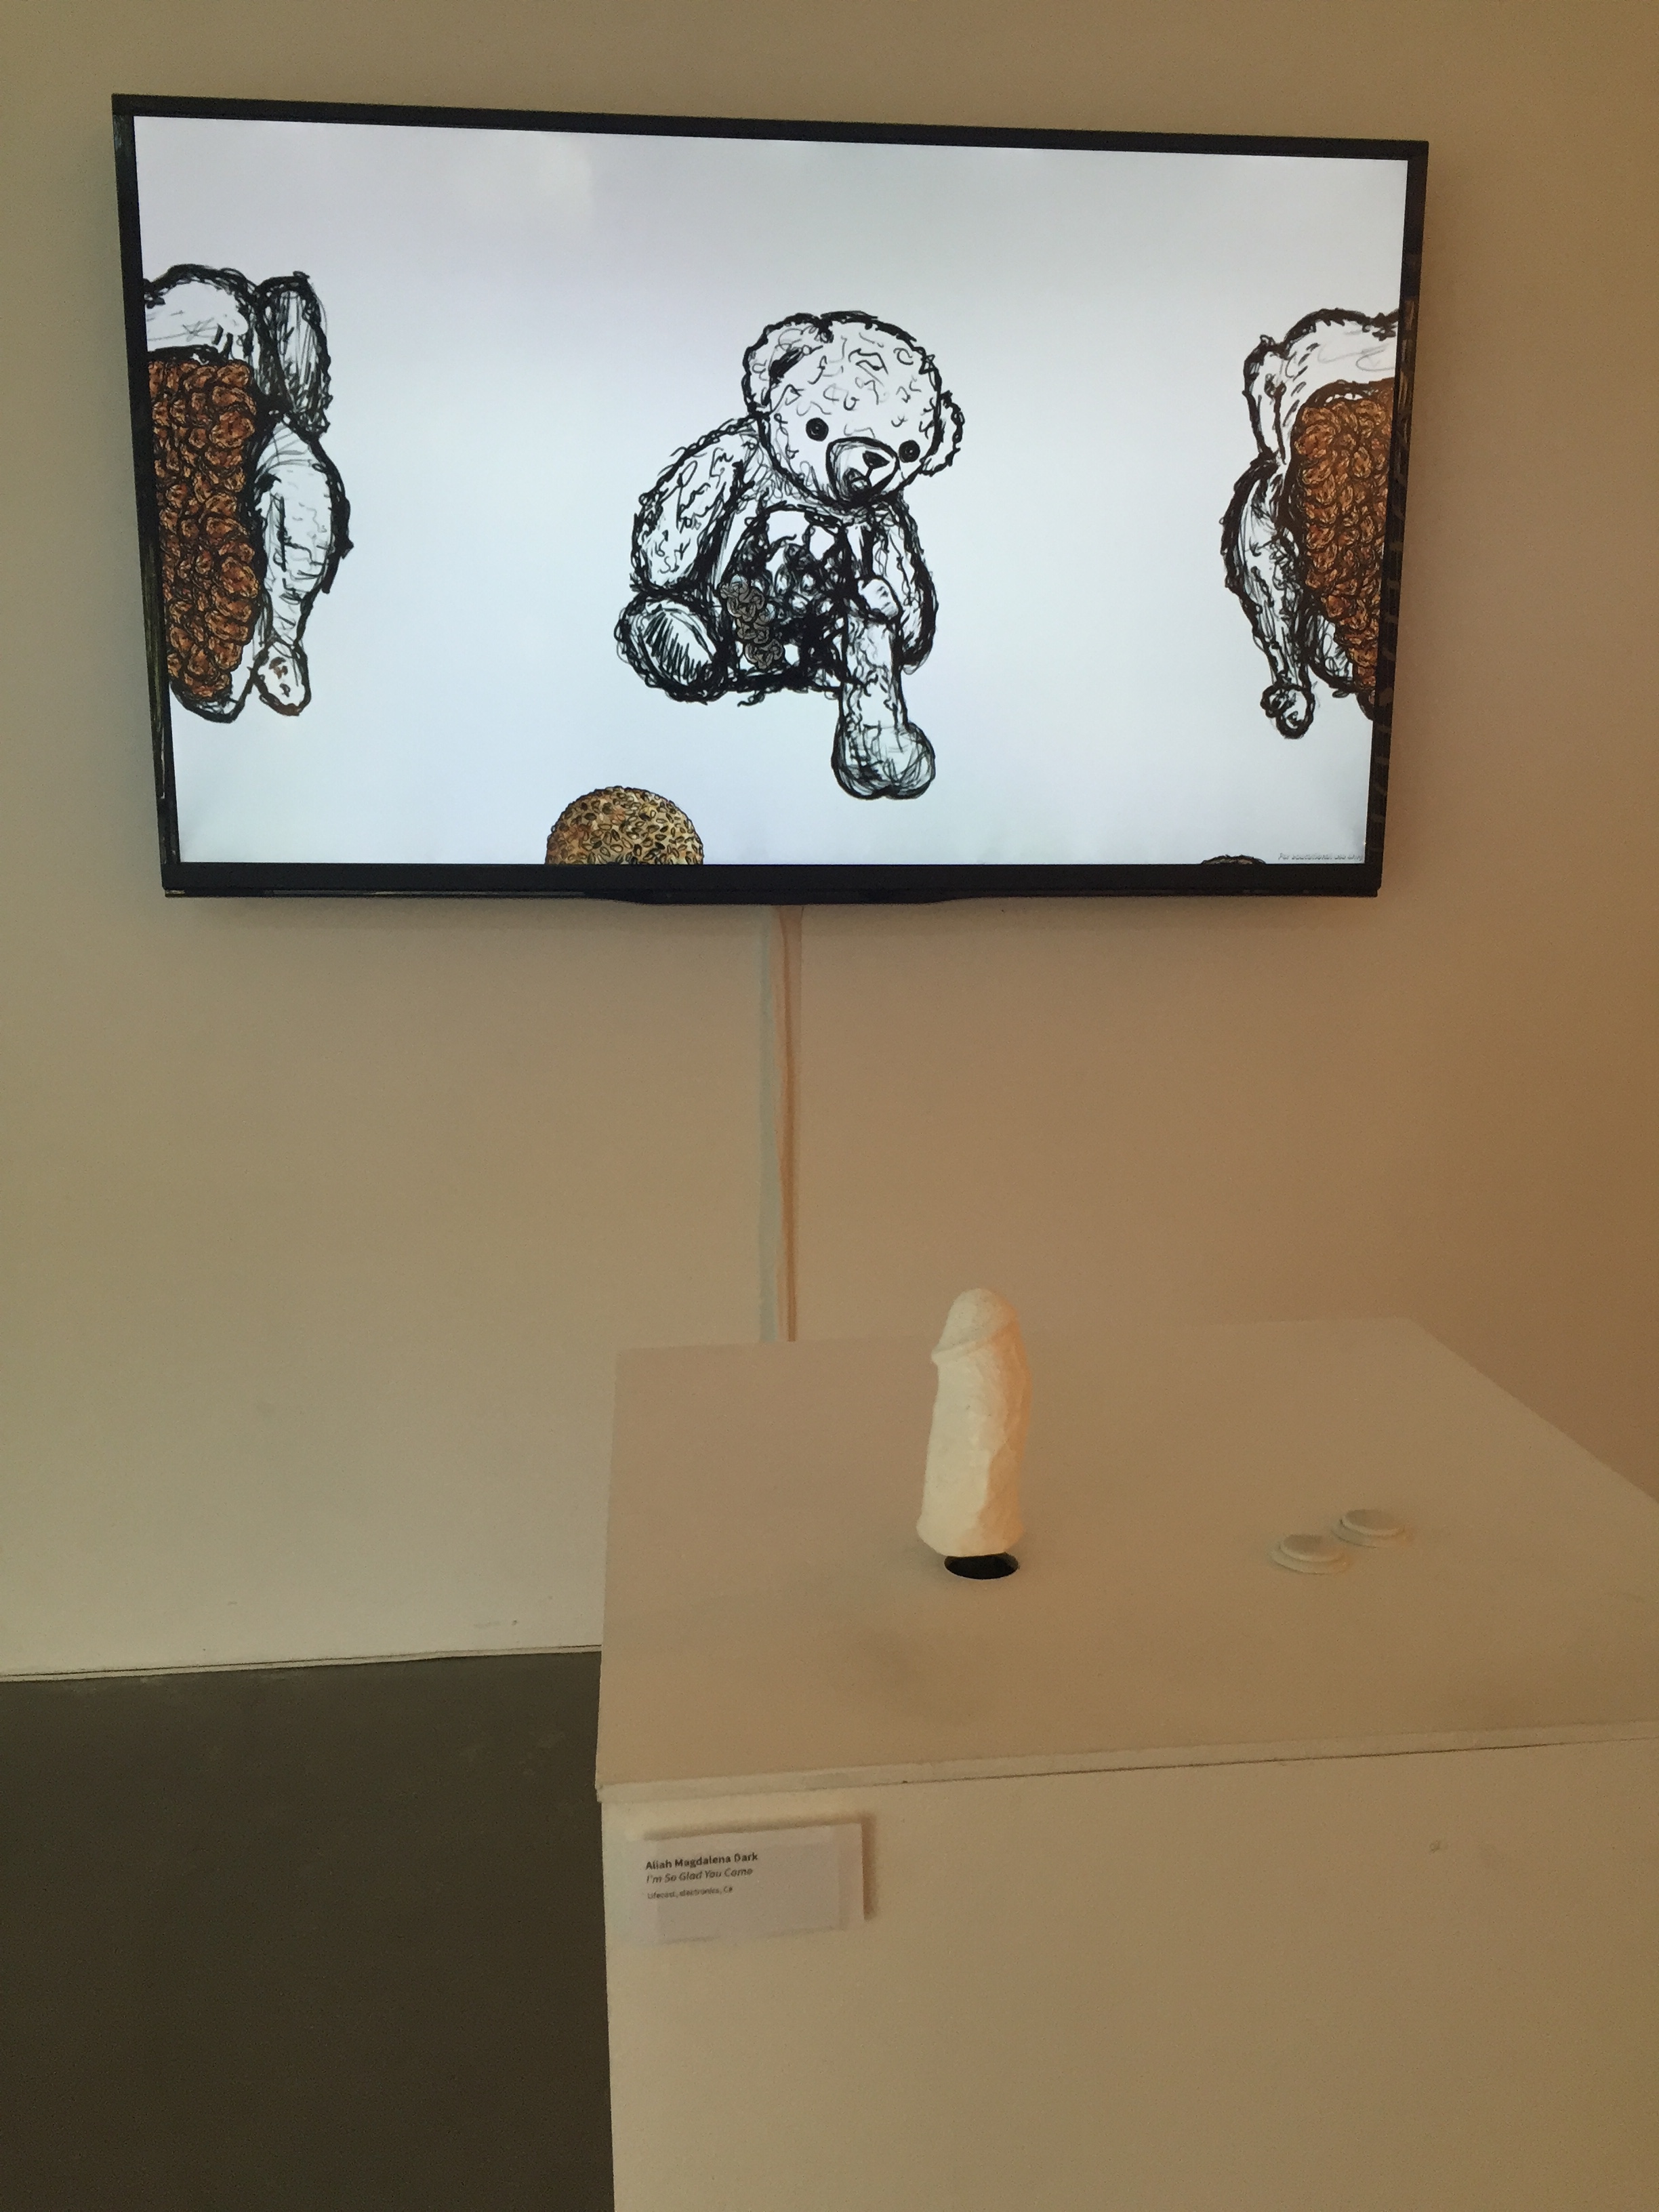
I thought this example was a very interesting intermediary between what is commonly considered a game versus an academic resource. Games have rules and they are often commercial by design. Although some games such as Assassin’s Creed attempt to create virtual environments based on historically-accurate data, I think that the difference is really illuminated when players become participants and are allowed to alter the fabric of the environment themselves or are deliberately invited to interpret the scene with a critical eye, rather than one that is pushed in a certain direction or given only certain tools to construct meaning within the environment itself.

Week 8: Interface as Art?

In his essay, “’So the Colors Cover the Wires:’ Interface, Aesthetics, and Usability” Matthew Kirschenbaum argues that today many users think of computer-aided interactivity in binary terms through the separation of application and appearance. According to Brena Laurel, the interface is what humans “talk” with, it is the thing that mediates humans and the inner workings of the machine. Although Laurel was arguing against this prevailing viewpoint, Kirschenbaum reminds readers that interfaces are both conceptually and computationally distinct from the applications they allow users to navigate.

IMG_4449Aliah Magdalena Dark’s “I’m So Glad You Came,” at the 2014 MFA exhibition.

In line with this view, I was reminded of a work of art I saw at this year’s DMA MFA exhibition, “.CALM.” If user interfaces are traditionally thought of as the medium through which an observer or user navigates a physical or digital environment, what happens when that medium becomes a piece of the application itself? The piece by Aliah Magdalena Dark, entitled “I’m So Glad You Came” invites observers to control the digital space on the screen by touching what appears to be a ceramic penis and pushing two white circular buttons to the right of the object. As the user becomes more comfortable with the idea of using this phallic object to navigate the space in front of them, it becomes clear that the ceramic penis in the interface is actually translated on to the monitor, and the buttons produce sperm, which “fill up” a variety of different objects on the screen. Regardless of the artist’s intended message, the piece brings up an interesting question of using interfaces design directly as an artistic component with the application or artwork itself. I think part of the reason which makes Dark’s piece so fascinating is the fact that application and appearance are blurred.

IMG_9919“Sneaky Cactus, Cactical Espionage,”at the 2014 International Games Day in Powell Library.

Another similar piece of interactive artwork reminded me of the possibility of artistic overlap between the interface and the application at the 2014 International Games Day at Powell Library entitled “Sneaky Cactus, Cactical Espionage.” This game requires that the player use actual cacti to navigate the virtual environment. As I was taking photos I watched numerous participants touch their fingers, seemingly worried about getting needles stuck in their palms. I think this game raises wonderful questions about the very nature of tactility in interfaces.

Dark’s piece and the Sneaky Cactus game take Kirschenbaum’s view that “computers compute, of course, but computers today, from most users’ points of view, are not so much engines of computation as venues for representation,” a step further by expanding the “venue of representation” to include the user interface.

Week 7: My House Could Have Burned Down (Again), and I Wouldn’t Have Even Known It!

Near the end of summer vacation, before I arrived back at UCLA for the start of the fall quarter, I was spending some time at home with my parents. It was probably about three or four in the afternoon, when my dad stepped outside on our patio to start grilling his dinner. Suddenly a very familiar smell flooded our living room—it smelled like a fire.

For those of you who have never experienced a summer wildfire first hand, its smell is very distinct. It’s different from a campfire or a fireplace in the winter. I stepped outside and saw bits of ash reigning down as Cal Fire planes started to fly by overhead and breathed in the heavy, hot air.

This scene was all-to-familiar to me, because in 2008 my house actually did burn down because of the Martin Fire (named after the road I live on). My house is situated up in the mountains, about a 20-minute drive from UCSC in Santa Cruz, California.

incidentfile273_534
2008 Martin Fire summary downloaded from Cal Fire’s archived fire database.

The reason I’m bringing all this up in this week’s posting is because the very first thing I did after I realized what might be going on was jump on Cal Fire’s Incident Information page in order to view their California Statewide Fire Map. In his article regarding the history and basics of web mapping, Jim Detwiler explains how dynamically-created web maps “are generated on the fly when the user loads the associated web page.” Cal Fire’s incident map should be considered a dynamic map because of the “real-time” updates it provides its viewers about fires currently burning in the state of California.

However, back in September when I was hurriedly searching their page to find information about a fire that was clearly happening only a few miles away from me at most, I found nothing about it. This is an interesting example about how in many ways, the data presented on dynamic maps or other online information repositories should perhaps be approached from more often a more “digitally humanistic” vantage point of awareness and interpretation. Just because a visualization is put up online and supported by a government website does not give it total authority or accuracy.

Because we couldn’t find any news at the time online, my parents decided to drive down the street and see if they could find any information about what was happening. About half an hour later they returned and told me that there was an electrical shortage about 3 miles down the road, which sparked the fire. Luckily, Cal Fire crews responded within 20 or 30 minutes of the outbreak and the fire was so small it didn’t spread more than a few acres. I tried searching again for the incident while writing this post, and I still couldn’t find anything about this fire online.

I think this is a great example of how we as digital humanists need to remain critical of all data that claims to be concrete or total in any way. Regardless of any certainty that is claimed, I think interpretation is crucial, because the majority of the time there’s probably some piece of information that’s missing.

Network Analysis in MMORPGs?

Back in high school, I had quite the embarrassing secret. I’d always loved playing games. When I was 7 my dad bought me a mac and I played games like Pajama Sam, Treasure Cove, or Barbie Detective. Over the years, I accumulated quite the collection of consoles, including a Nintendo 64, a Gamecube, as well as an Xbox 360. But around the 9th grade, a different kind of gaming sensation entered into my collection: the World of Warcraft (or WoW) took its place within my interactive media canon.

The reason I’m bringing up such a formidable yet relatively awkward and humiliating phase of my life this week is because I feel as though there are interesting parallels to be made regarding topics in network analysis, topic mapping and metadata with WoW and MMORPGs (Massively Multiplayer Online Role Playing Games) in general. In his blog post, Scott Weingart defines networks as “any complex, interlocking system.” In the game, there are an overwhelming number of possibilities of network analyses that can be created because of the overwhelming quantity of metadata available regarding game players and related player statistics. What I found so fascinating about the possibility of using WoW data to create network analyses after reading Weingart’s post was the fact that in many ways because we’re talking about an interactive computer game in which users make choices about their race, class, realm type, as well as their social interactions with other people while playing online, this environment might represent a place where the digital humanist and computer scientist can both extract data and conduct different types of network analysis.

Screen Shot 2014-11-14 at 7.55.29 PM

A visualization of guilds, and players by race, class and level on my old server, Moon Guard [RP].

From the digital humanist’s perspective, a scholar might look at individual players on the server as “nodes”based on race, class, level or even a player’s name and use the guild system as “edges” to draw connections between these agents. In doing this, a scholar interested in online social interactions may be able to determine how different social groups on the server are configured and make inferences from that relationship. Using a unimodal schema, centrality of each agent could be determined to analyze its importance to the network in general.

I think there are a lot of other possibilities and applications for analyzing data taken from other MMORPGs, not just WoW. I also believe WoW could be a potentially valuable resource to discuss in our “ALT Narratives” project group when discussing online communities and narratives created socially with a preexisting lore or framework provided by entertainment companies like Blizzard (the creators of WoW).

Week 5: The Changing Definition of “Risk” as Capta


Back in the winter of 2013, I was a research assistant for Dr. Matt O’Hara of the University of California, Santa Cruz’s department of History and Latin American and Latino Studies. His research centered on the examination of the history of time in colonial Mexico and the Spanish Inquisition.

After reading Dr. Johanna Drucker’s text “Humanities Approach to Graphical Display,” I was immediately reminded of many of the sources I encountered during my time as a research assistant under Dr. O’Hara. One article in particular, entitled “Uncertain Times: the Notion of ‘Risk’ and the Development of Modernity” by Gerda Reith stuck in my mind as being relevant to Drucker’s article.

In her essay, Reith explores the “ways in which understandings of uncertainty have evolved during the development of modernity, and in particular, how they are expressed in the notion of ‘risk.'” Through a temporally heterogeneous analysis ranging from the medieval to the modern, Reith demonstrates how the definition and idea of what it means to take risks are embedded in socio-economic contexts and grounded in particular temporal orientations, specifically as expressed in notions of determinism and indeterminism.

If the humanistic approach which Drucker discusses in her text is centered in the experiential in which “capta” should be taken actively and “data” are assumed to be a given, capta will reflect the divergent experiences of each generation on a temporal scale. After rereading Reith’s article I found that the connection between how humans perceive notions of risk in many ways reflects how Drucker suggests that digital humanists today should interpret and display data.

In her article Reith states that “so, as long as human actors who perceive and think and respond are involved in the probability equation, there can be no such thing as ‘objective’ risk.” Here Reith both highlight’s Drucker’s theory of data as capta by pointing to each generation’s different interpretation of the notion of risk, and also shows us that the idea behind risk itself is rooted in the impossibility of a singular, real or objective point of datum. In other words, the both the perception and later observation of risk is changeable and open for human interpretation.  In her article, Drucker asserts that all eras representation’s of knowledge are distinct, and divergent from the next. Reith explains that during the medieval period and other periods where technological control over the natural world was limited, uncertainties were expressed and managed through a range of religious or magical concepts such as luck or fate, but around he seventeenth century, dramatic developments in social, intellectual and economic life transformed ideas about uncertainty, the future and human agency through the growth of economic systems such as capitalism, credit, and insurance. During the early modern era, perceptions of risk shifted and allowed for greater human intervention as opposed to a reliance on faith or luck for an explanation of teleology.

I think Professor Drucker’s approach to the study of digital humanities with “capta” is honorable because it holds true to the traditions of what it means to conduct scholarly research within the sphere of the humanities, while still employing new forms of technology to support those inquiries.

View Reith’s article here: http://tas.sagepub.com/content/13/2-3/383.full.pdf

Week 4: Disparate Arrivals, Ellis Island and Slave Journeys

In Companion to Digital Humanities, Stephen Ramsay asserts that: “The design of [databases] has been a mainstay of humanistic endeavor for centuries; the seeds of the modern computerized database being fully evident in the many text-based taxonomies and indexing systems which have been developed since the Middle Ages.” This analysis, coupled with Emory University’s Trans-Atlantic Slave Trade Database got me thinking about the origins of my own family in California, and ultimately the United States.

Back in 2001, I took a trip to New York with my mom and dad on vacation. Unsurprisingly, we visited Ellis Island in hopes of discovering our long-lost relatives names on one of the ship’s manifests. If my memory serves correctly, I was able to find several passengers on my father’s side that emigrated from Ireland during the fin de siècle era.

After exploring the Emory database this weekend, I got curious not so much about the content of registry at Ellis Island, but how this data is displayed online today in comparison with that of the Trans-Atlantic Slave Trade Database. I registered myself as a user at http://www.libertyellisfoundation.org/. Obviously both databases seek to tell the story of demographic historical shifts, however the presentation of information on both reflects the starkly different story told by the journeys reflected in the data. The Ellis Island database projects color, imagery and an aura of excitement through its user interface, while the Emory database limits photos and presents African passengers in a much less human light than the stories highlighted in the former.

Screen Shot 2014-10-26 at 10.32.31 PMScreen Shot 2014-10-26 at 10.57.31 PM

After I signed up, the Ellis Island database asked me to “Become a Member” by contributing just $50.00 per year, and adding a photo in order to “Honor [my] Ancestors, [my] Family and [myself].” The rhetoric of honoring my family and the very personal connection the database attempts to make with its audience contrasts starkly with that of the Emory database.

The very function of searching someone by name, a crucial component of many immigrant’s stories and identities who entered the U.S. through Ellis Island during the early 20th century is not even an option within the Trans-Atlantic Slave Trade Database. In the basic Ellis Island search there isn’t even another input field other than first name, initial or last name! I find it fascinating how today we can access and view information through digital databases that still overtly reflect the historical period or population on which they are based.

Screen Shot 2014-10-26 at 11.17.11 PMScreen Shot 2014-10-26 at 11.18.06 PM


Bliss: Crafting a Successful Symbology

Screen Shot 2014-10-19 at 4.13.33 PM Stained glass art by Shirley McNaughton, called “Communication.” It’s composed of 10 Bliss symbols.

What is a sign? According to the French philosopher Charles Sanders Peirce, signs are: “something, which stands to somebody for something in some respect or capacity.” At least, that’s the one of the definitions Professor Erkki Huhtamo of the Design/Media Arts program offered us in lecture last week. We broke it down further by dividing up signs into two categories: the “signifier,” or the visible/interpretable form the sign takes, and the “signified,” or the idea the sign expresses. Essentially, signs are defined by humans. Nothing is a sign unless it can be interpreted through a shared culture or ontology.

This past summer, I found myself listening to a wonderful episode of the RadioLab podcast, entitled “Bliss.” One of the subsections of this episode focused on the story of one man named Charles Bliss, who created a system of signs entitled “Bliss Symbolics.” Like many of his time, Mr. Bliss was disillusioned with the dystopian chaos of the post-WWII world, and in turn believed he could heal the miscommunication and destruction he saw around him through a universal system of iconic signs, which all humans would be able to use in order to understand and communicate with one another, regardless of language.

Unfortunately for Bliss, his system of symbols never took root in the global manner that he had envisioned. However, in 1971 a nurse named Shirley McNaughton began using Bliss Symbolics to help children with cerebral palsy develop language skills. Eventually, these children were able to speak basic English by developing written skills using Bliss Symoblics to communicate with their instructors. Over time, Bliss’ signs began to develop to meet the specific needs of children, which eventually traveled around the world. In each place, the symbols would inevitably become tweaked to fit the rules and linguistic ontologies specific to that culture. Bliss Symoblics in Israel were written from right to left, because Hebrew is written from right to left. Bliss’ hope of a universal and unchanging semiotic language was a complete failure.

In many regards, the problem of “mismatched ontologies” presented by Wallack and Srinivasan link directly to the discussion of how the creation and reading of Bliss’ signs played into human culture, education and communication. The localization and specification of Bliss’ signs to small groups of children around the world reminded me of the problems states face in developing broad ontologies that attempt to force large groups of diverse people together in a binary census. The signs that were appropriated from Bliss’ semiotics proved successful in teaching children to speak because they were modified to fit local customs and cultures. In their article, Wallack and Srinivasan point to this exact issue and explain how “any object, attribute, category or relation included within a local ontology could be included in a meta-ontology…there is no reason [Governments] could not also incorporate folkloric relations that guide community perceptions.” Inevitably, local communities know best what it is that is required to successfully educate their children. If governments give their citizens the ability to define themselves on a local level like many different groups did using Charles Bliss’ symbols, I think information loss and infrastructural dysfunction could be significantly diminished in the future across the globe.

Check out the podcast here: http://www.radiolab.org/story/257194-man-became-bliss/

Week 2: The “Social Responsibility” of Archives (Smithsonian Style)

After delving into the material assigned for this week’s readings, I couldn’t help but find myself reminiscing about the past summer, which I spent living in Washington D.C., working as a (regrettably) unpaid intern at the Smithsonian Institution’s Center for Folklife and Cultural Heritage, abbreviated as the CFCH (that’s me, on the left in the blue dress).

During my internship I worked largely within the Center’s archives, processing different art and correspondence collections, and attempting to discern what might be worth including in recent digitization efforts funded by a federally subsidized, and therefore unsurprisingly modest budget. Along with other interns (namely my friend on the right, Heather), we sorted through hundreds of original works of art from records produced at the Center during the 20th century (you can browse many of the recordings here: http://www.folkways.si.edu/folkways-recordings/smithsonian).  The works of album artwork that we processed were  historically produced as a part of an  effort to release more unconventional or unorthodox music during the 1950s and 60s, when government censorship and the era of McCarthyism surged across the nation. Some of the most famous folk musicians of the 20th century such as Woody Guthrie and Pete Seeger recorded with Folkways and left original works of art and recordings in the hands of the Smithsonian’s CFCH. Even at an institution as prestigious as the Smithsonian, these materials were not accessible to the public online. Individuals are still required to make an appointment to view the collection, and many of the materials have yet to be cataloged at all.

During our efforts, we grappled with many of the same questions brought to light by Chon Noriega in “Preservation Matters,” such as what the function of our collections were on both a public and an institutional level, and what the responsibility of the Center was in preserving these historic materials. Essentially, our boss wanted us to pick out particularly good examples of well-preserved or exceptional works of art to be digitized and eventually put online for public access. However in doing this, we were adding weight to Gamboa’s theory that it was impossible to give an accurate account of a  history because of the very fact that these materials were part of an archive. Heather and I were selecting what history would be publicly shown, and which pieces of art would remain hidden away or potentially even discarded (such as those with hazardous mold or other damages). I think this is one of the most universally important things to keep in mind when using archives and collections. True “History,” is unknowable because archives are an imperfect and meager snapshot of what happened, how it happened and who was involved.

For more information on the archives and collections I worked with check out these links:

http://www.folklife.si.edu/

http://www.folklife.si.edu/archive