I chose the project “Robots Reading Vogue” because I was intrigued by the applications of computer technology and computational power when applied to analyzing fashion trends. Fashion magazines are something that almost everyone is familiar with, and thus may be indicative of larger trends in society or popular movements and time periods. Vogue, in particular, has been published for over a century now, and so this project was created by Peter Leonard, Yale’s Librarian for Digital Humanities Research, and Lindsay King, an arts librarian who suggested using Vogue Archive. With support from many collaborators and funding from a research grant, they were able to conduct many experiments on this humongous dataset and bring forth new areas of research interest in the field of digital humanities. 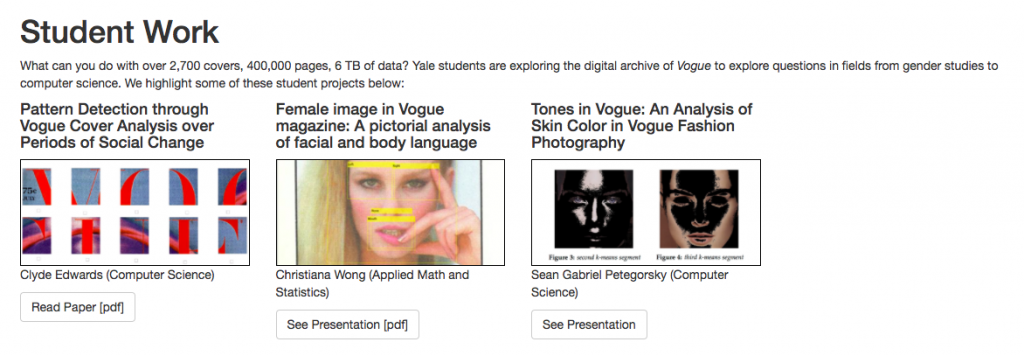
Using the 6 terabytes of data from the Vogue Archive, both student and faculty members were able to run many different studies and analyses on multiple components of the dataset. For example, Leonard and King used Bookworm, a way to visualize trends in texts that is similar to the Google N-Gram Viewer, to illustrate what specific words (as words per million) were more popular or less popular in those digital collections from 1892 to 2013.

Although the word “sexy” was almost nonexistent before 1960, it rose in popularity around the 2000s before dipping down again, while the word “pretty” had the opposite trend: it was the most popular out of all four of the words before decreasing in frequency in more recent decades. The researchers not only visualized the trends of how often a word appeared, but displayed them in color coordinated graphs so that the user can also look up other related words. In this manner, it is also more aesthetically pleasing than just a series of numbers and the average user can also conduct their own searches for fashion-related vocabulary.
Another interesting project was Topic Modeling Vogue, which involved using a natural language processing software called MALLET in order to cluster together words that appeared more frequently near each other. This technology uses machine learning and Markov models to analyze all the words from the many digital texts in the dataset, and display them a a way that would be easily understood by the public. They used different sizes of words, with the most frequent ones shown in the brightest colors in the center of the cluster, and words that were farther away or not as related on the edges.
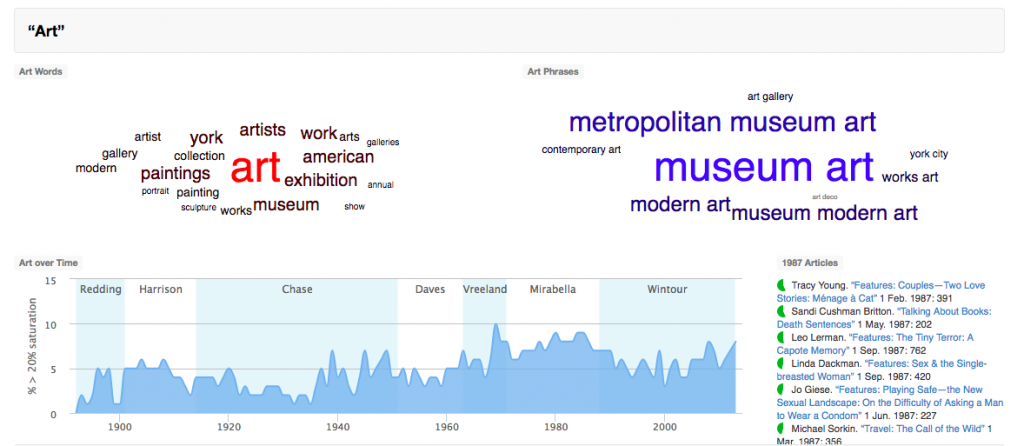
With this project, they not only analyzed common words such as “art”, “travel”, and “food”, but they also looked into “women’s health” and “politics”. The largest bolded words would then be considered to have the highest levels of occuring together, and the graphs underneath the clusters also show what articles were most highly-saturated with those themes during a certain time period. Similar to the previous project, these data visualizations and popular words would be useful to know because it may reflect past social trends and influences. With steadily increasing computational power and more datasets becoming publicly available, it may be possible to even study these past relationships and patterns and extrapolate that information to predict future ones.
I also picked Robot’s Reading Vogue to reverse engineer, but I found your post more interesting to read – haha. I like how many screenshots of data you inserted in. I droned on and on about how many different ways Leonard and King allowed us to view the data, but only attached on screenshot. Well done!
I also chose the Robots Reading Vogue project to reverse engineer for similar reasons as yourself! I thought that it was incredibly interesting to apply the tools of technology and digitalization to an industry like fashion; the two research topics don’t often seem to be talked about in the same context. I really enjoyed your approach to this DH project; you were able to pinpoint certain areas of the project that interested you and came up with unique approaches to see how the data would respond. For example, searching for the four words in the n-gram word frequency visualization “lovely”, “pretty”, “beautiful”, and “sexy”, was an innovative approach to understanding how people perceive and discuss women’s beauty throughout the decades that Vogue was being published. I think this is an especially interesting resource to understand the perception of women’s beauty over the decades because Vogue has historically been able to set the precedent for how women view themselves and society around them. Well done!
Hi, I really enjoyed reading your blog post. I also thought the project was pretty interesting, since I am highly interested in data analysis. I have done a similar but much less extensive research on financial data using Google Analytics before, but did not really reorganize raw materials myself, since the system did it for me automatically. It is fascinating to see how they created those visually comprehensible and interesting analysis from tons of data as well as drawing meaningful conclusion on cultural trends changing over time. Since Vogue is one of the most sensitive and trendy magazines, I think the project touches the most important signals of modern culture and society. Reading your blog post helped me to understand the conclusion of each computed graphs. Great job!