“Robots Reading Vogue” is a joint project conducted by both Lindsay King and Peter Leonard. This archive consists of a large collection of digitalized Vogue content which individuals utilize to explore topics such as gender studies.
Sources: The “Robots Reading Vogue” project consists of the Vogue Archive which was launched by ProQuest and Conde Nast in 2011. The archive consists of 27,000 covers, 400,000 pages, and 6 TB of data.
Processing: Individuals utilized various processing techniques in order to categorize and analyze the data sets.
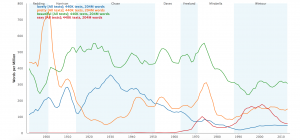
Individuals use an n-gram search in order to search and compare word usage in all of the texts in the database. For example, (as shown above) the words “lovely” and “sexy” have been used in 440k texts.
In addition, slice histograms are used to process archival Vogue content. Slice histograms divide all of the images in a dataset into various colors.
Also, in order to process the large archive of Vogue content, computer program clustered words for the topics on each page. For example, “travel words” such as beach, house, city and town were clustered together.
Another way that individuals have processed the Vogue Archive is by sorting the magazine advertisements by frequency, date and industry. For example, in 1990, 0.50 ads per issue were for Maybelline Co.
Presentation: Vogue Archive material is presented on such diagrams as slice histograms, color metric spaces, and topic models.

In Averaging Covers in Vogue, covers in magazines were collected from each year and manually overlaid on one another (as shown above).
In addition, many Yale students have utilized this database to create projects in order to answer questions pertaining to such topics as gender studies. For example, Christiana Wong created a project titled “An Analysis of Vogue Fashion Photography’s Implications about the Female Face.” She processed 849,167 images from the Vogue Archive. She concluded from the archive that faceism grows linear over time.
I thought the way you organized your post was very well done and easy to read through. When you explained the process, you also gave examples which allowed me to understand the general concept of the project better without having to click onto the actual link. I also liked how you concluded your post with a interpretation of what the data means, not only explaining the source, process, and presentation.